How to Use the Periodontal (Perio) Chart in Invent Medical
Learn how to start a periodontal exam, record measurements across all six sites per tooth, manage missing teeth and faster entry modes, switch between chart views, and export the finished Perio Chart.
Module Overview & Layout
The Perio Chart gives dentists and dental clinic staff an interactive periodontal charting tool. It records pocket depths, gingival margin, recession, bleeding, furcation, and mobility across six sites per tooth, with automatic attachment level, bleeding-on-probing (BOP), and plaque index calculations — giving a fast, complete picture of a patient's periodontal health.
The exam screen is organized around a few key areas:
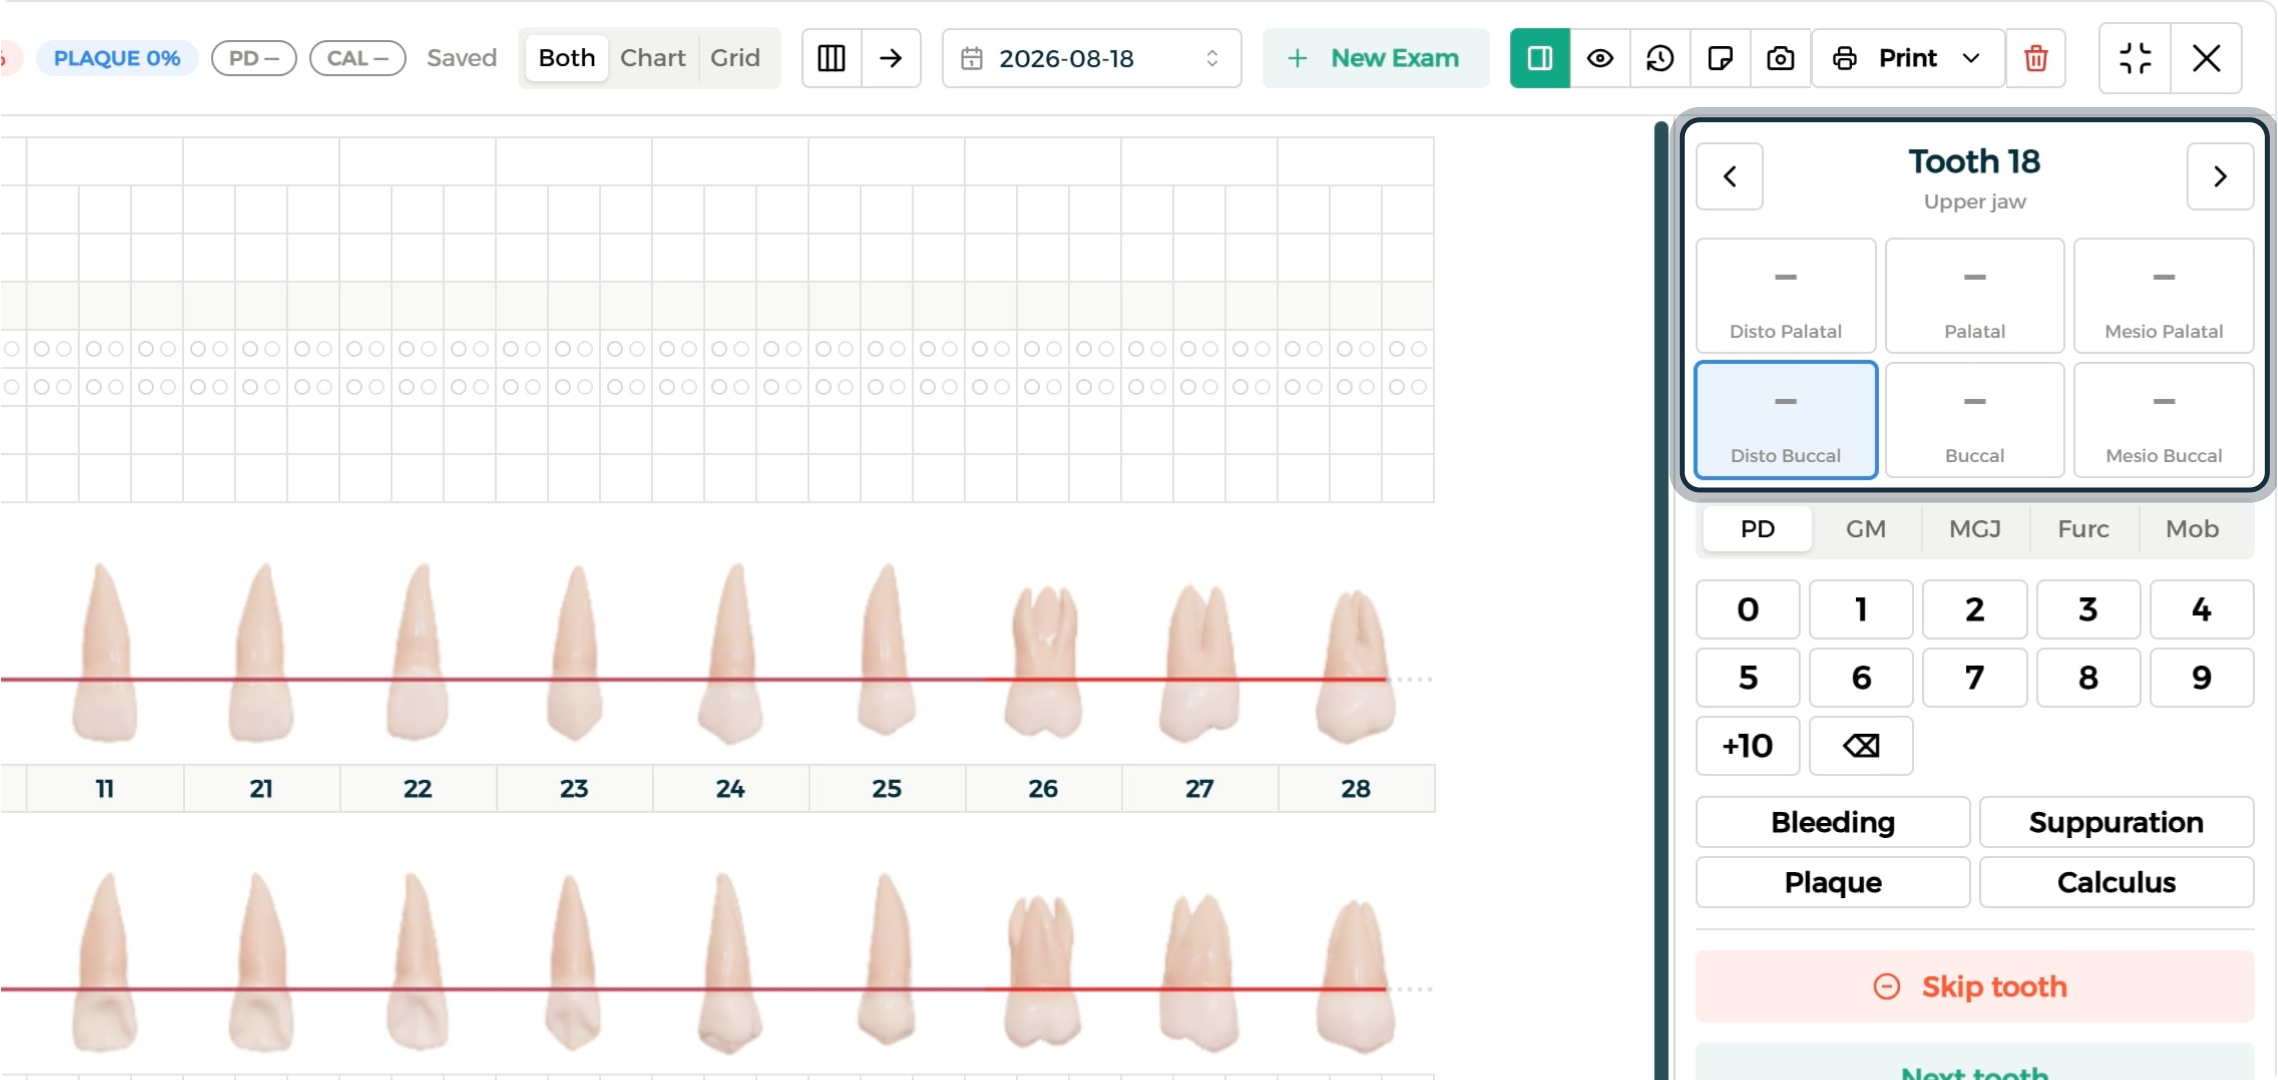
- Tooth panel — shows the selected tooth number, jaw location, and its six measuring sites.
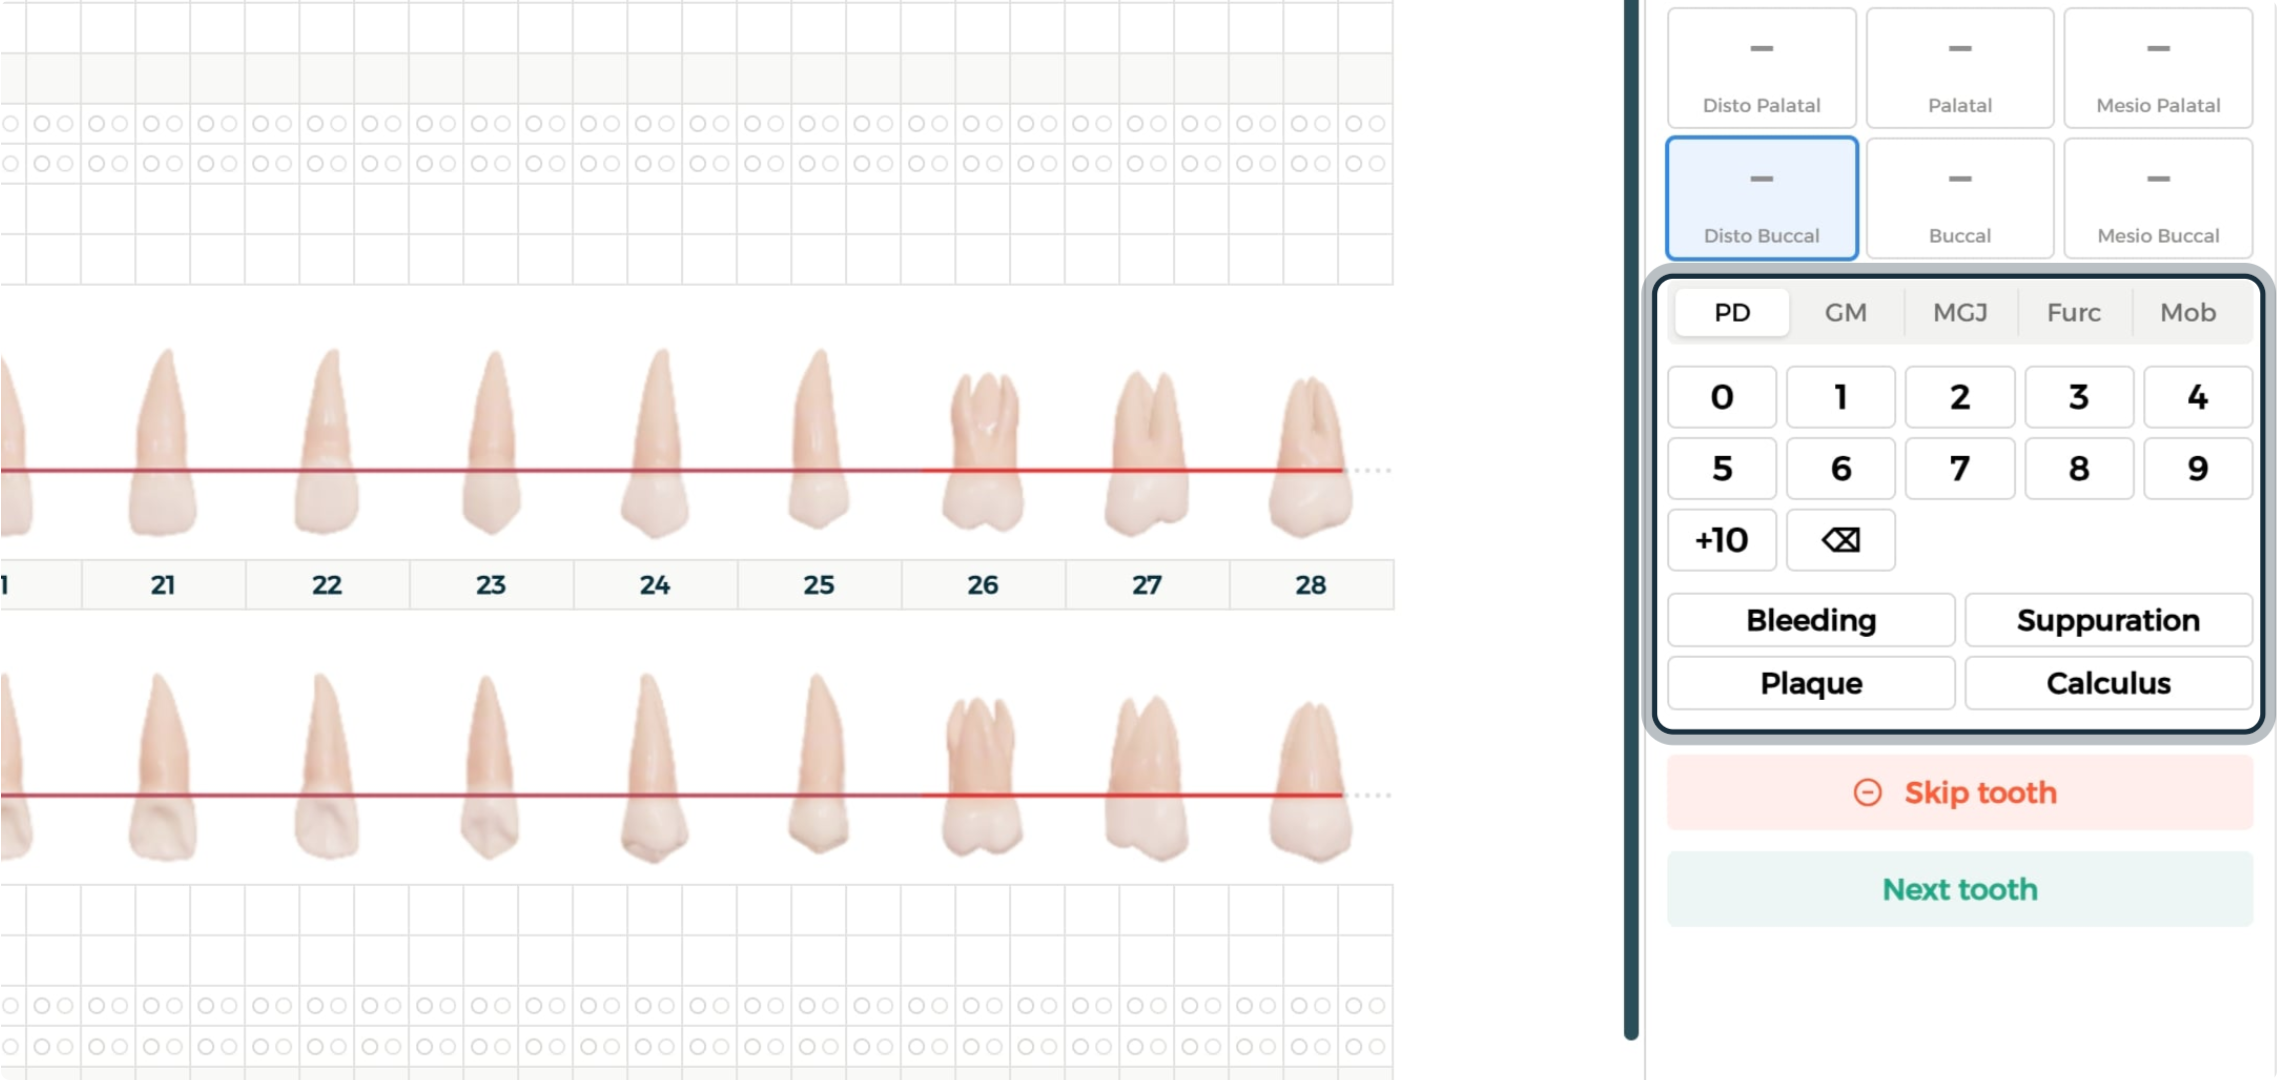
- Measurement tabs — Probing Depth (PD), Gingival Margin (GM), MGJ, Furcation, and Mobility.
- Quick-entry keypad & Clinical Surface Indicators — for logging numeric values plus bleeding, suppuration, plaque, and calculus.
- Chart / Grid / Both view toggle — switches between the visual chart, a numeric grid, or both together.
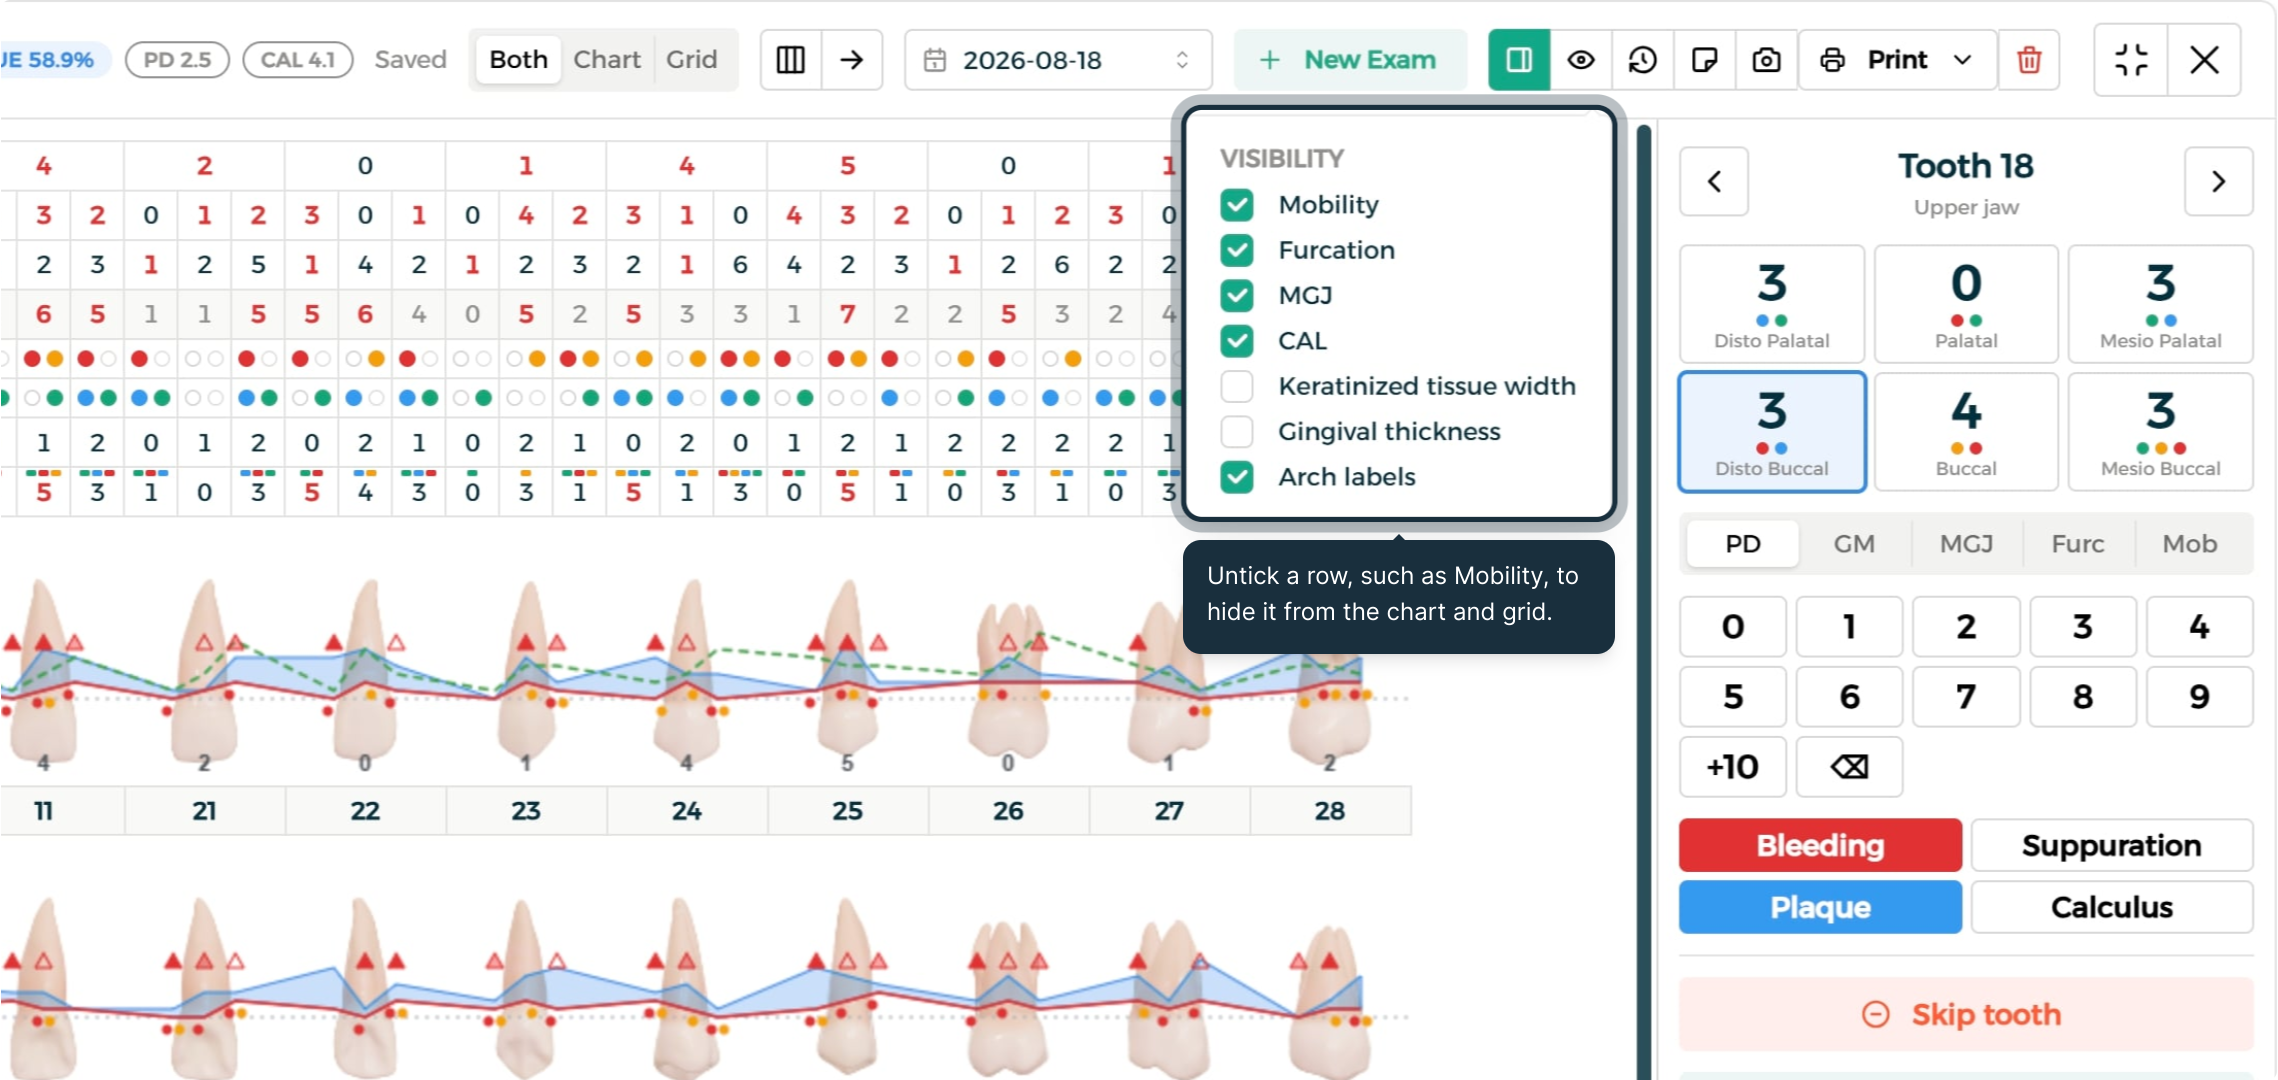
- Visibility menu — controls which measurement rows show on the chart and grid.
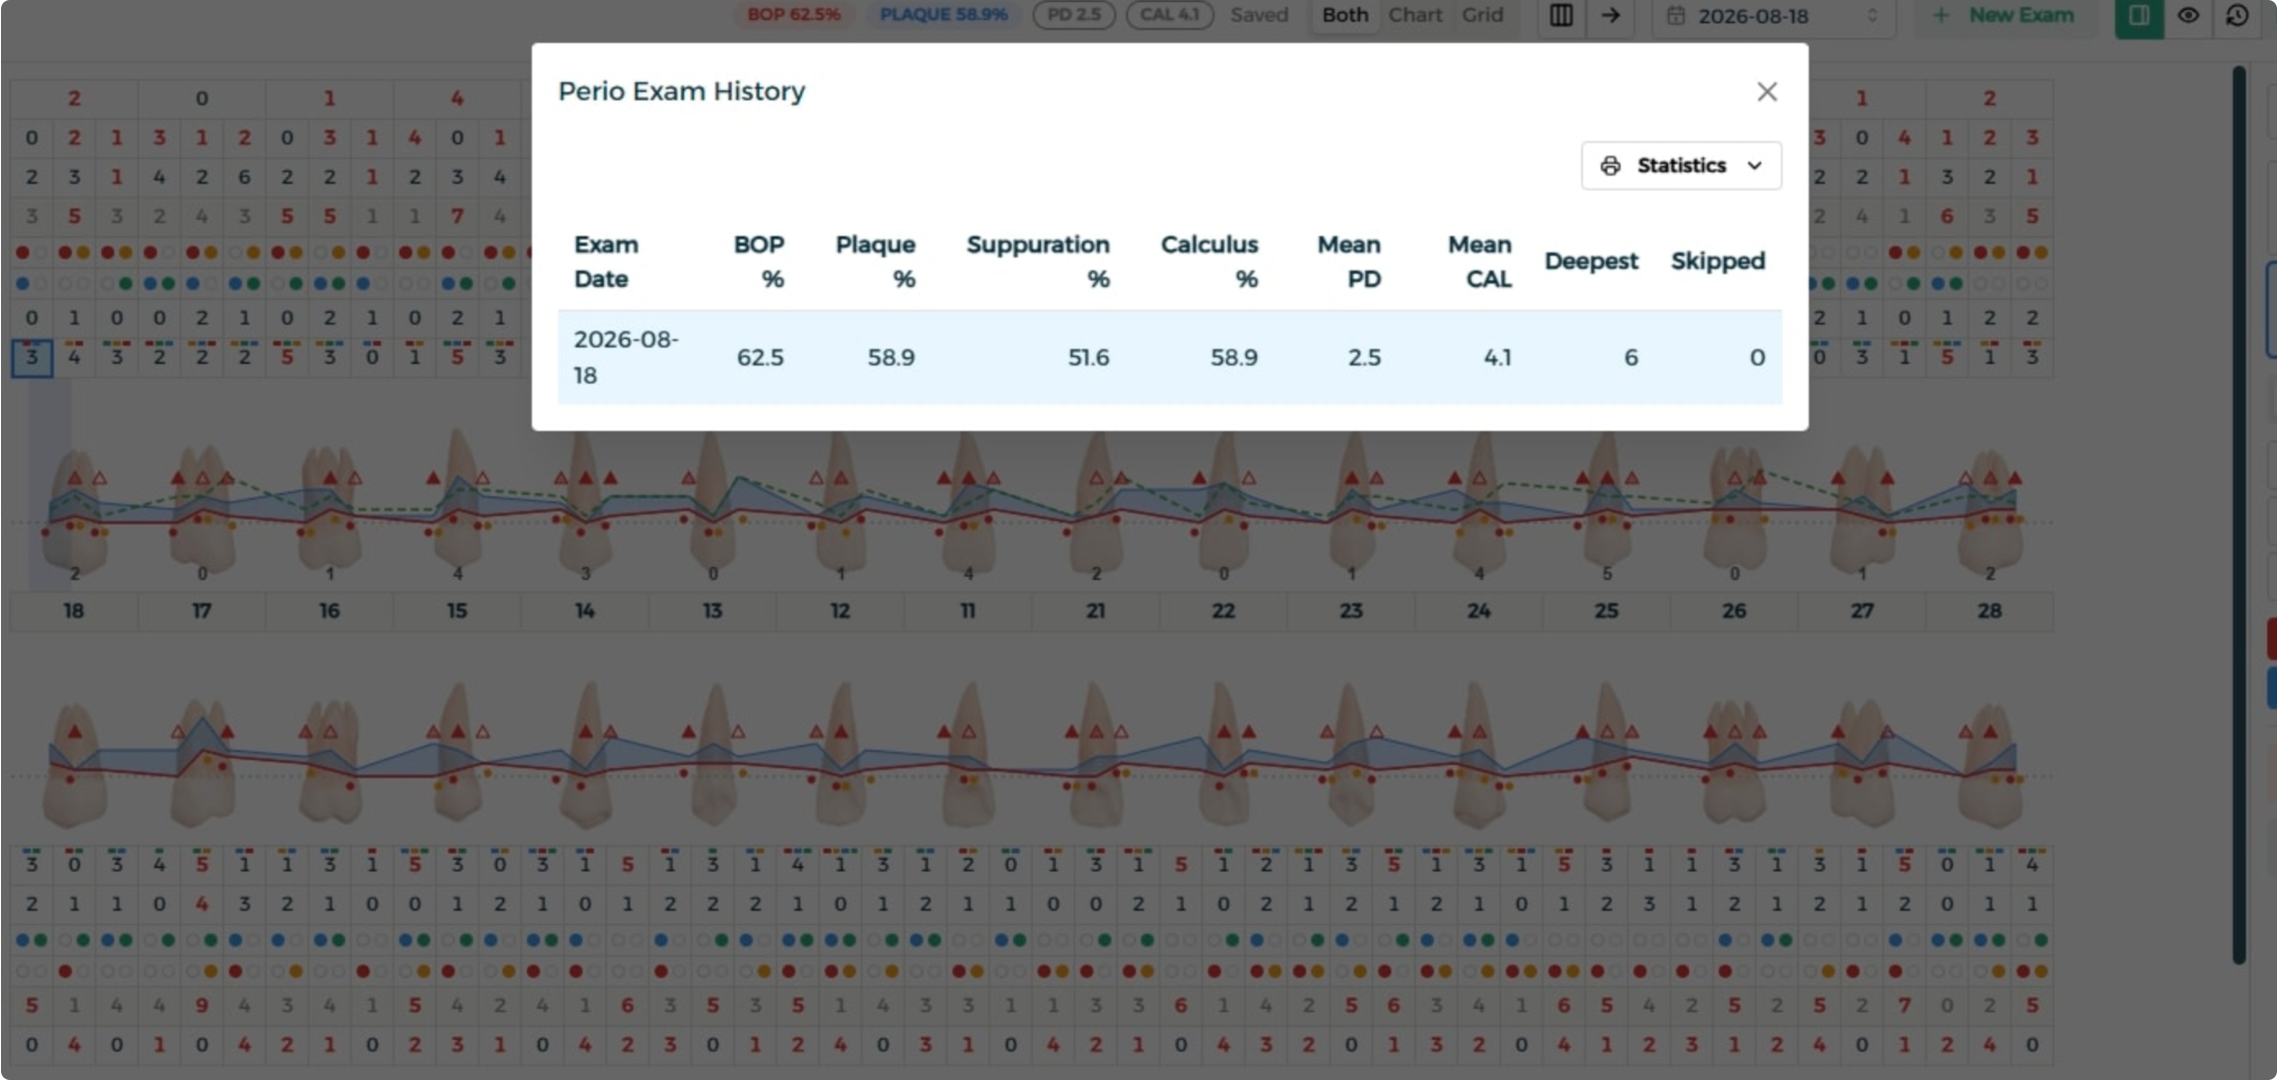
- Exam history — lists every past exam with its indices for comparison over time.
- Print / export controls — for previewing, printing, or downloading the completed exam.
Together, these give clinical staff a fast, structured way to document a full periodontal exam and track a patient's gum health over time.
Step-by-Step Process
Opening a Patient's Perio Chart
Step 1: Open the Chart Library
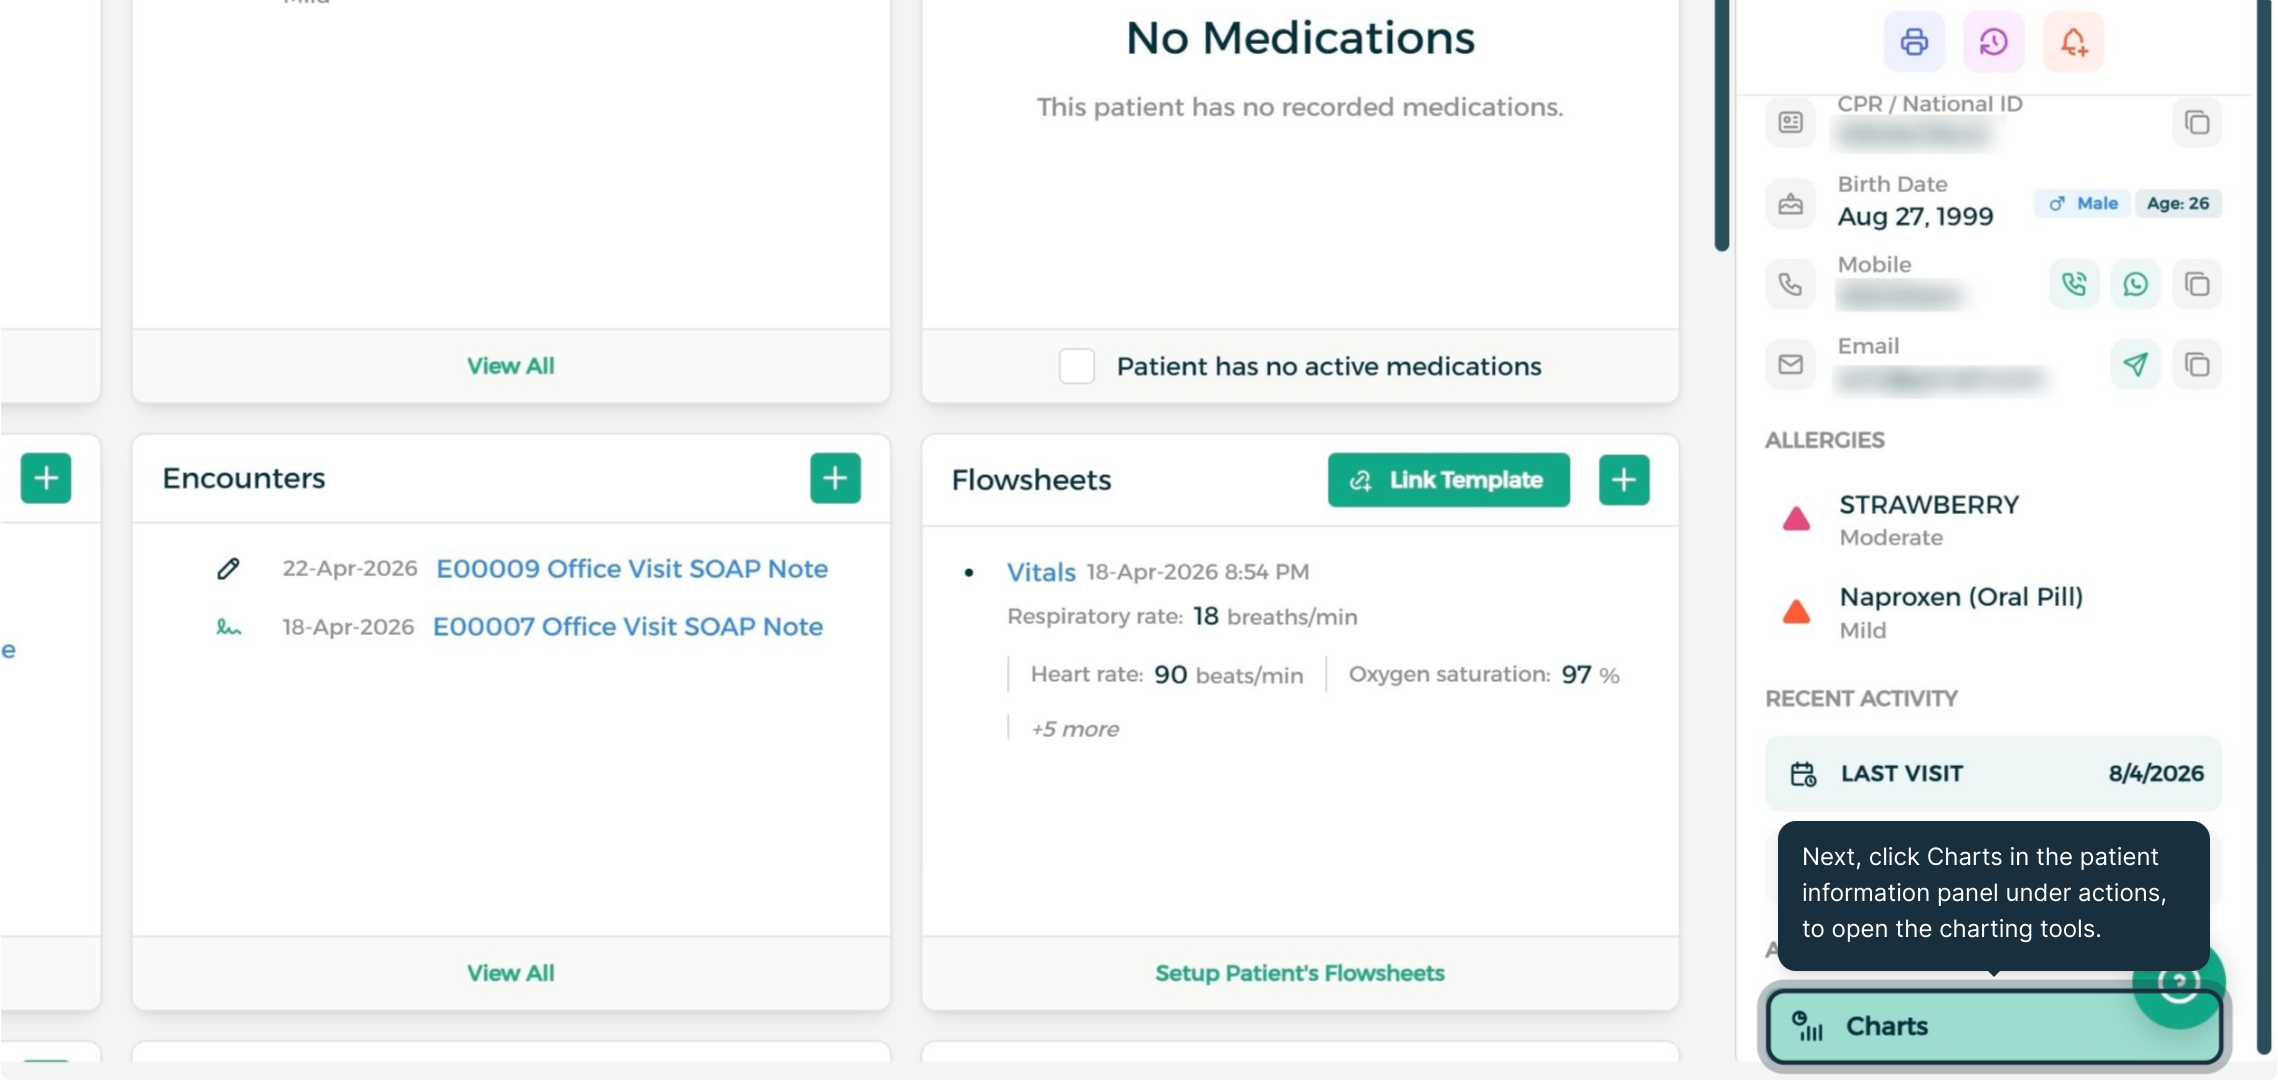
From the Patient Profile, open the Actions panel and click Charts, then click Select a Chart to view the available charts.
Step 2: Select the Perio Chart and Start a New Exam
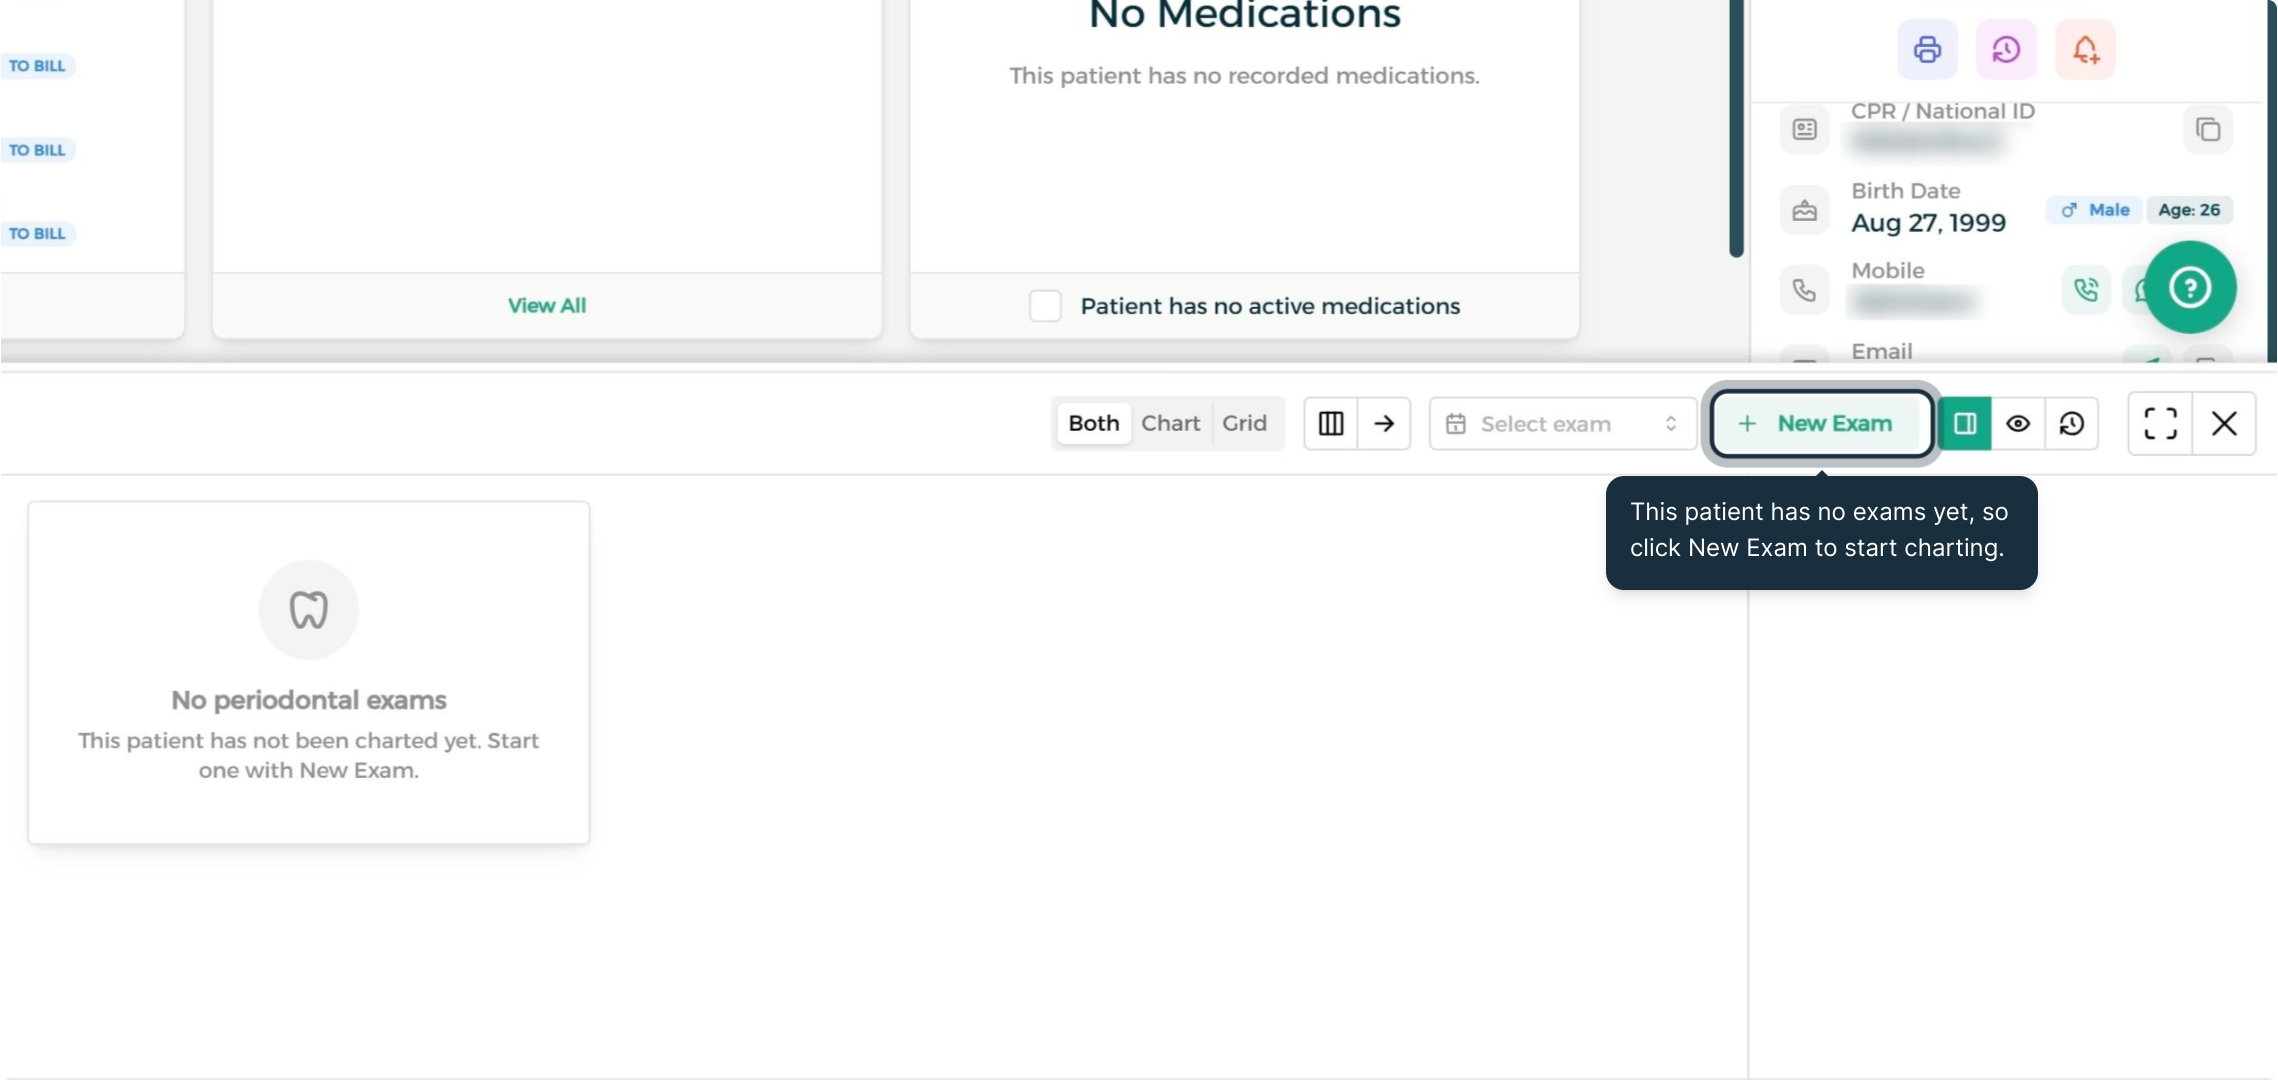
Choose Perio Chart to open the interactive periodontal charting tool. If the patient has no previous exam, click New Exam to begin recording one.
Understanding the Exam Layout
Step 1: Review the Tooth Panel
The tooth panel on the right shows the selected tooth number, jaw location, and its six measuring sites.
Step 2: Review the Measurement Tabs and Indicators
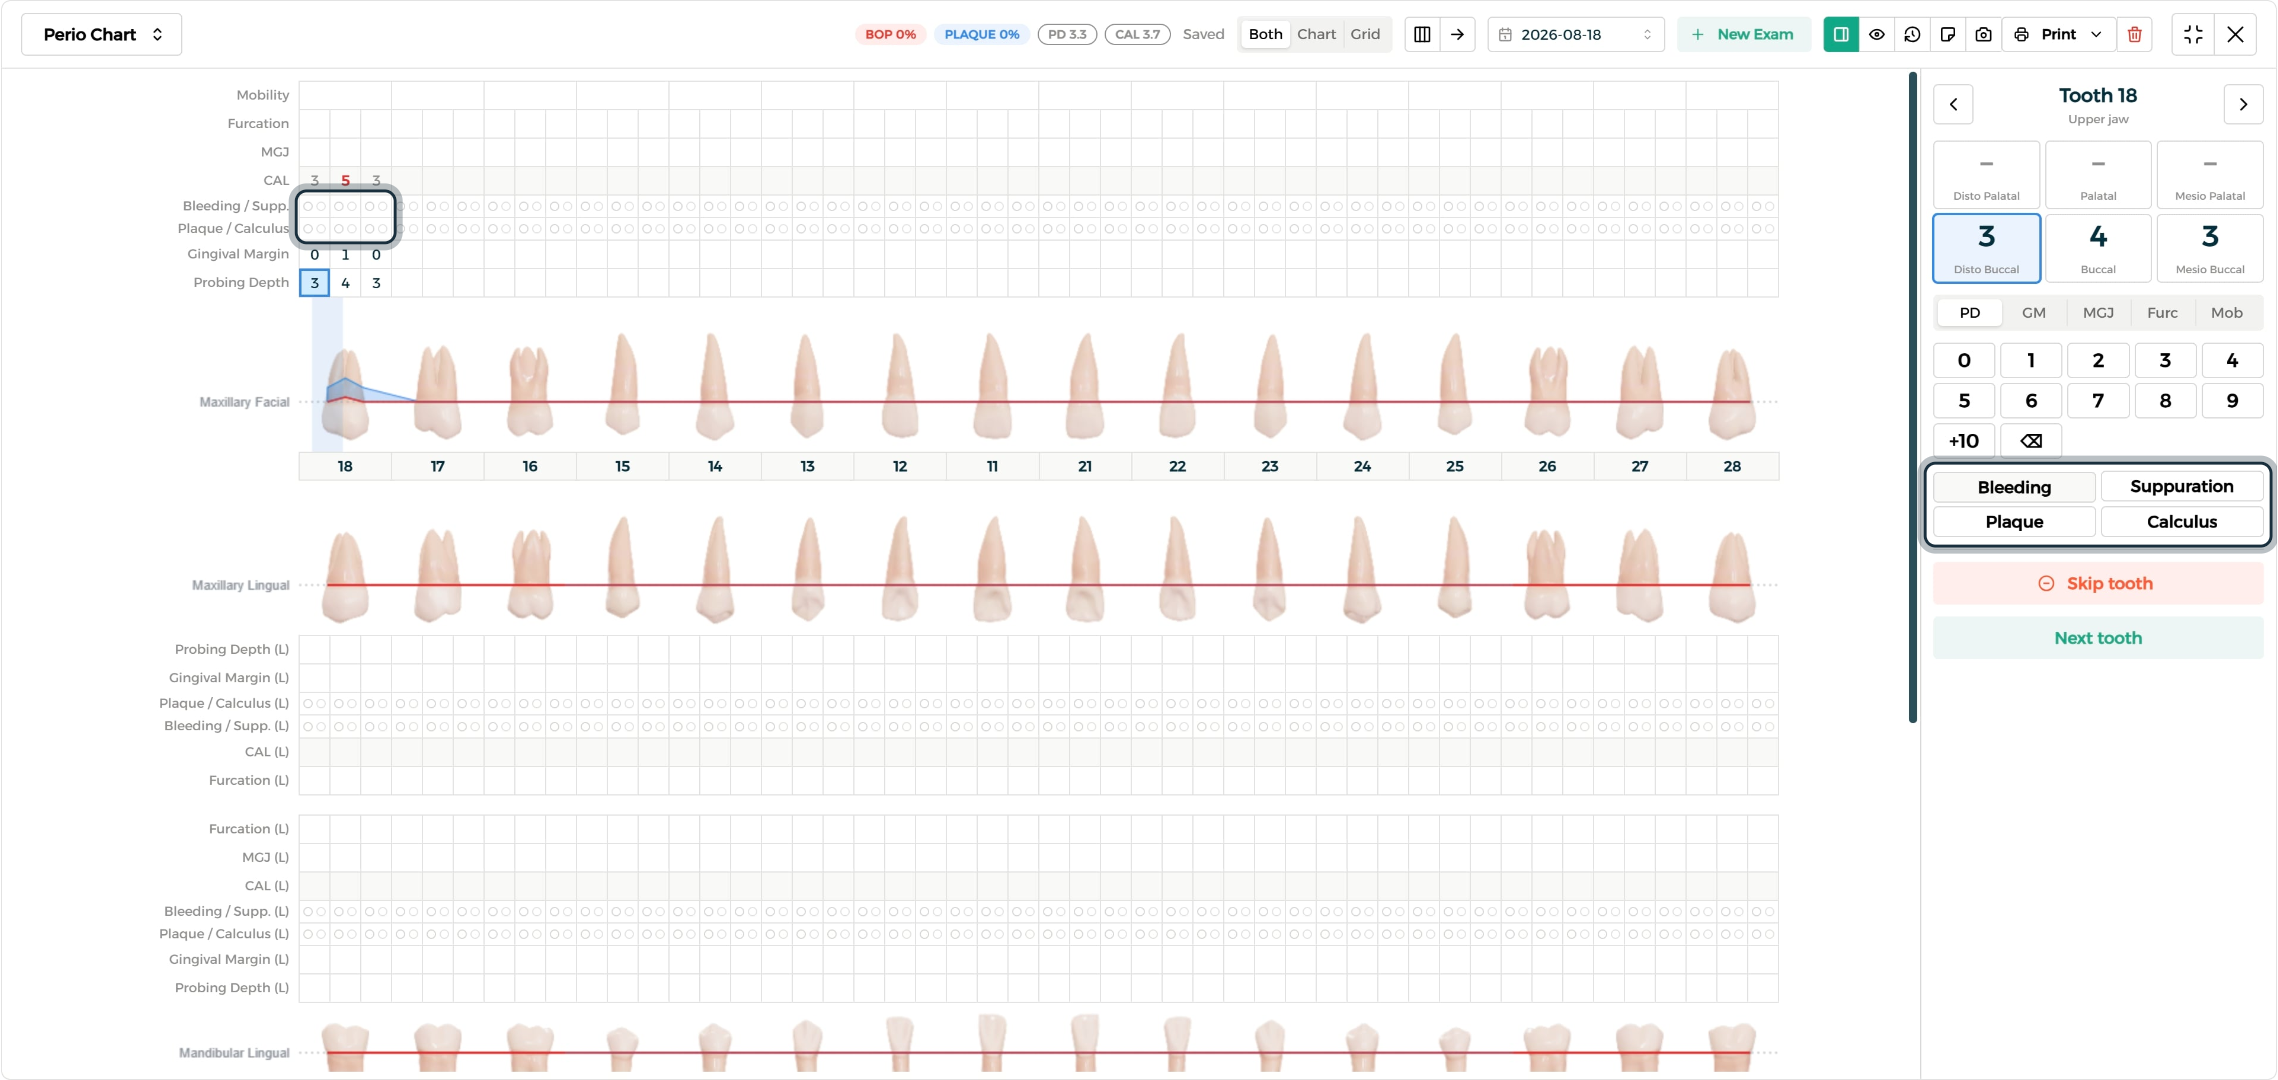
Below the tooth panel are the measurement category tabs, a quick-entry number pad, and the Clinical Surface Indicators — bleeding, suppuration, plaque, and calculus — so every clinical detail can be logged from one place.
Recording Measurements for a Tooth
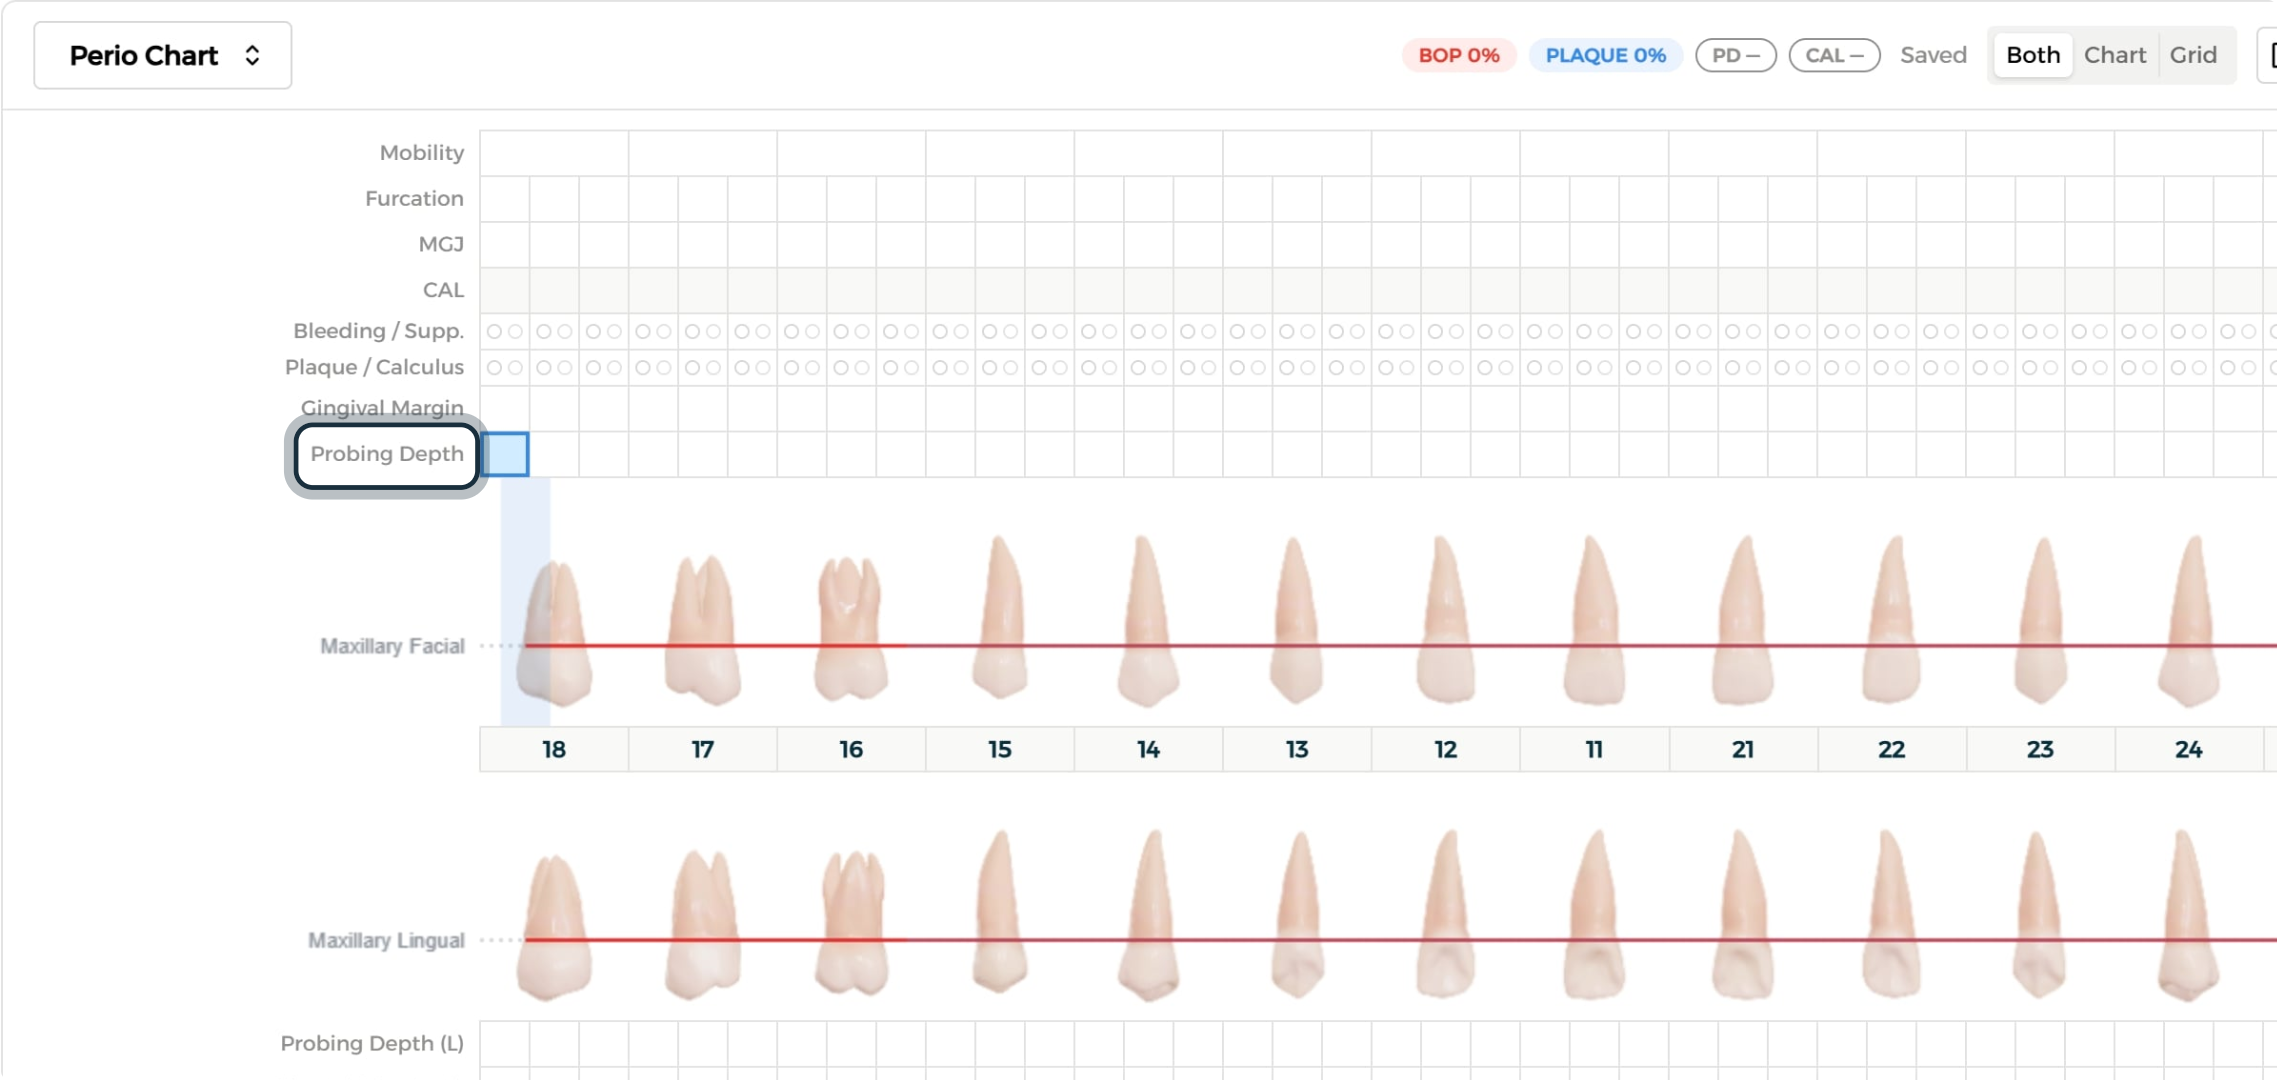
Step 1: Enter Probing Depth
Enter the probing depth using the on-screen keypad or your keyboard. The chart dynamically visualizes every recorded measurement in real time.
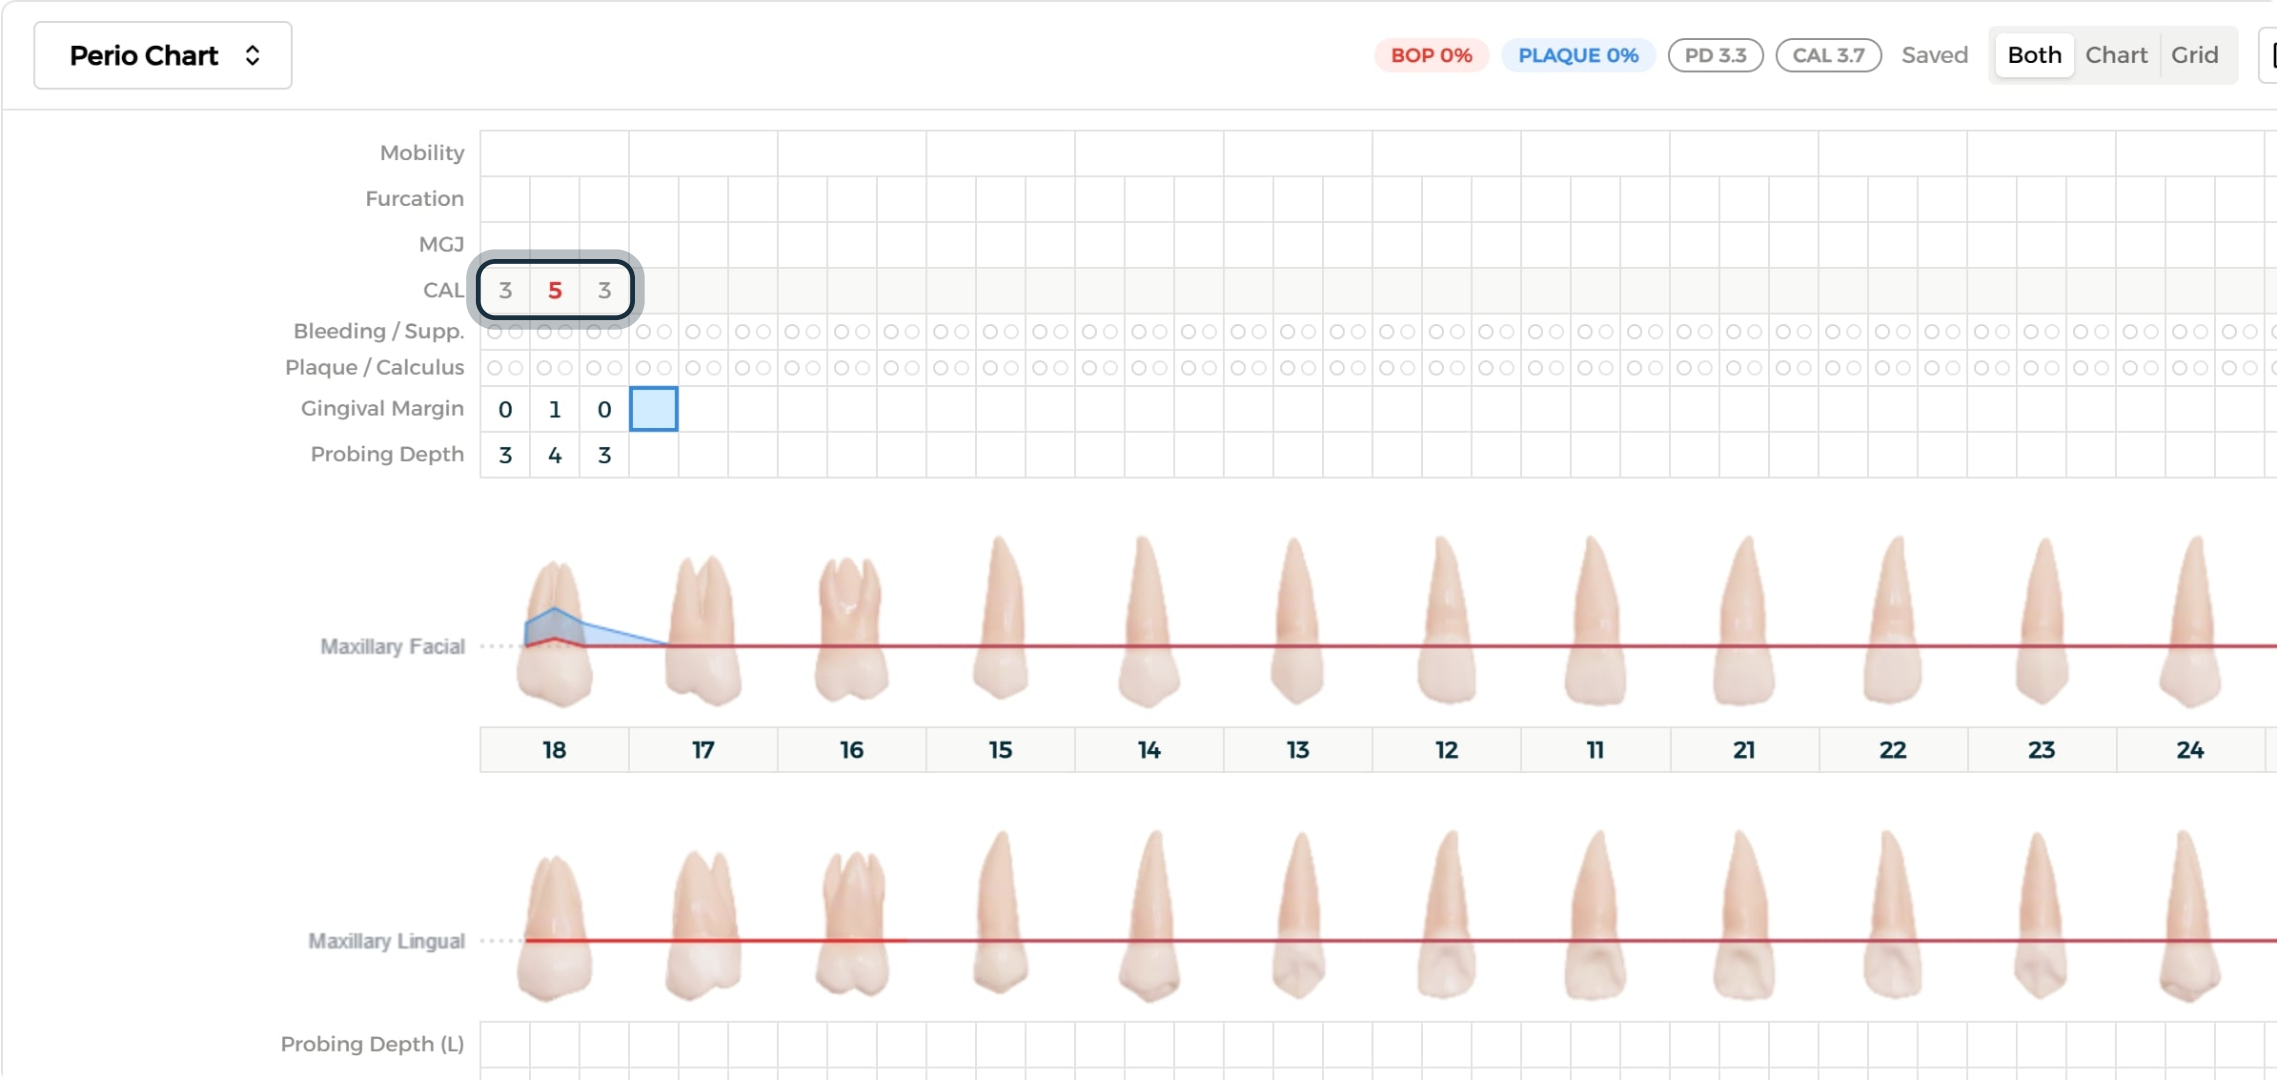
Step 2: Enter Gingival Margin
Record the gingival margin the same way. Once logged, the Clinical Attachment Level calculates automatically, and any measurement that hits a critical threshold is flagged in red — thresholds can be customized in the medical settings.
Logging Clinical Surface Indicators and Remaining Measurements
Step 1: Log Clinical Surface Indicators
Click the indicator buttons on the right, or select directly on the grid — a single click logs bleeding or plaque, while shift-click logs suppuration or calculus.
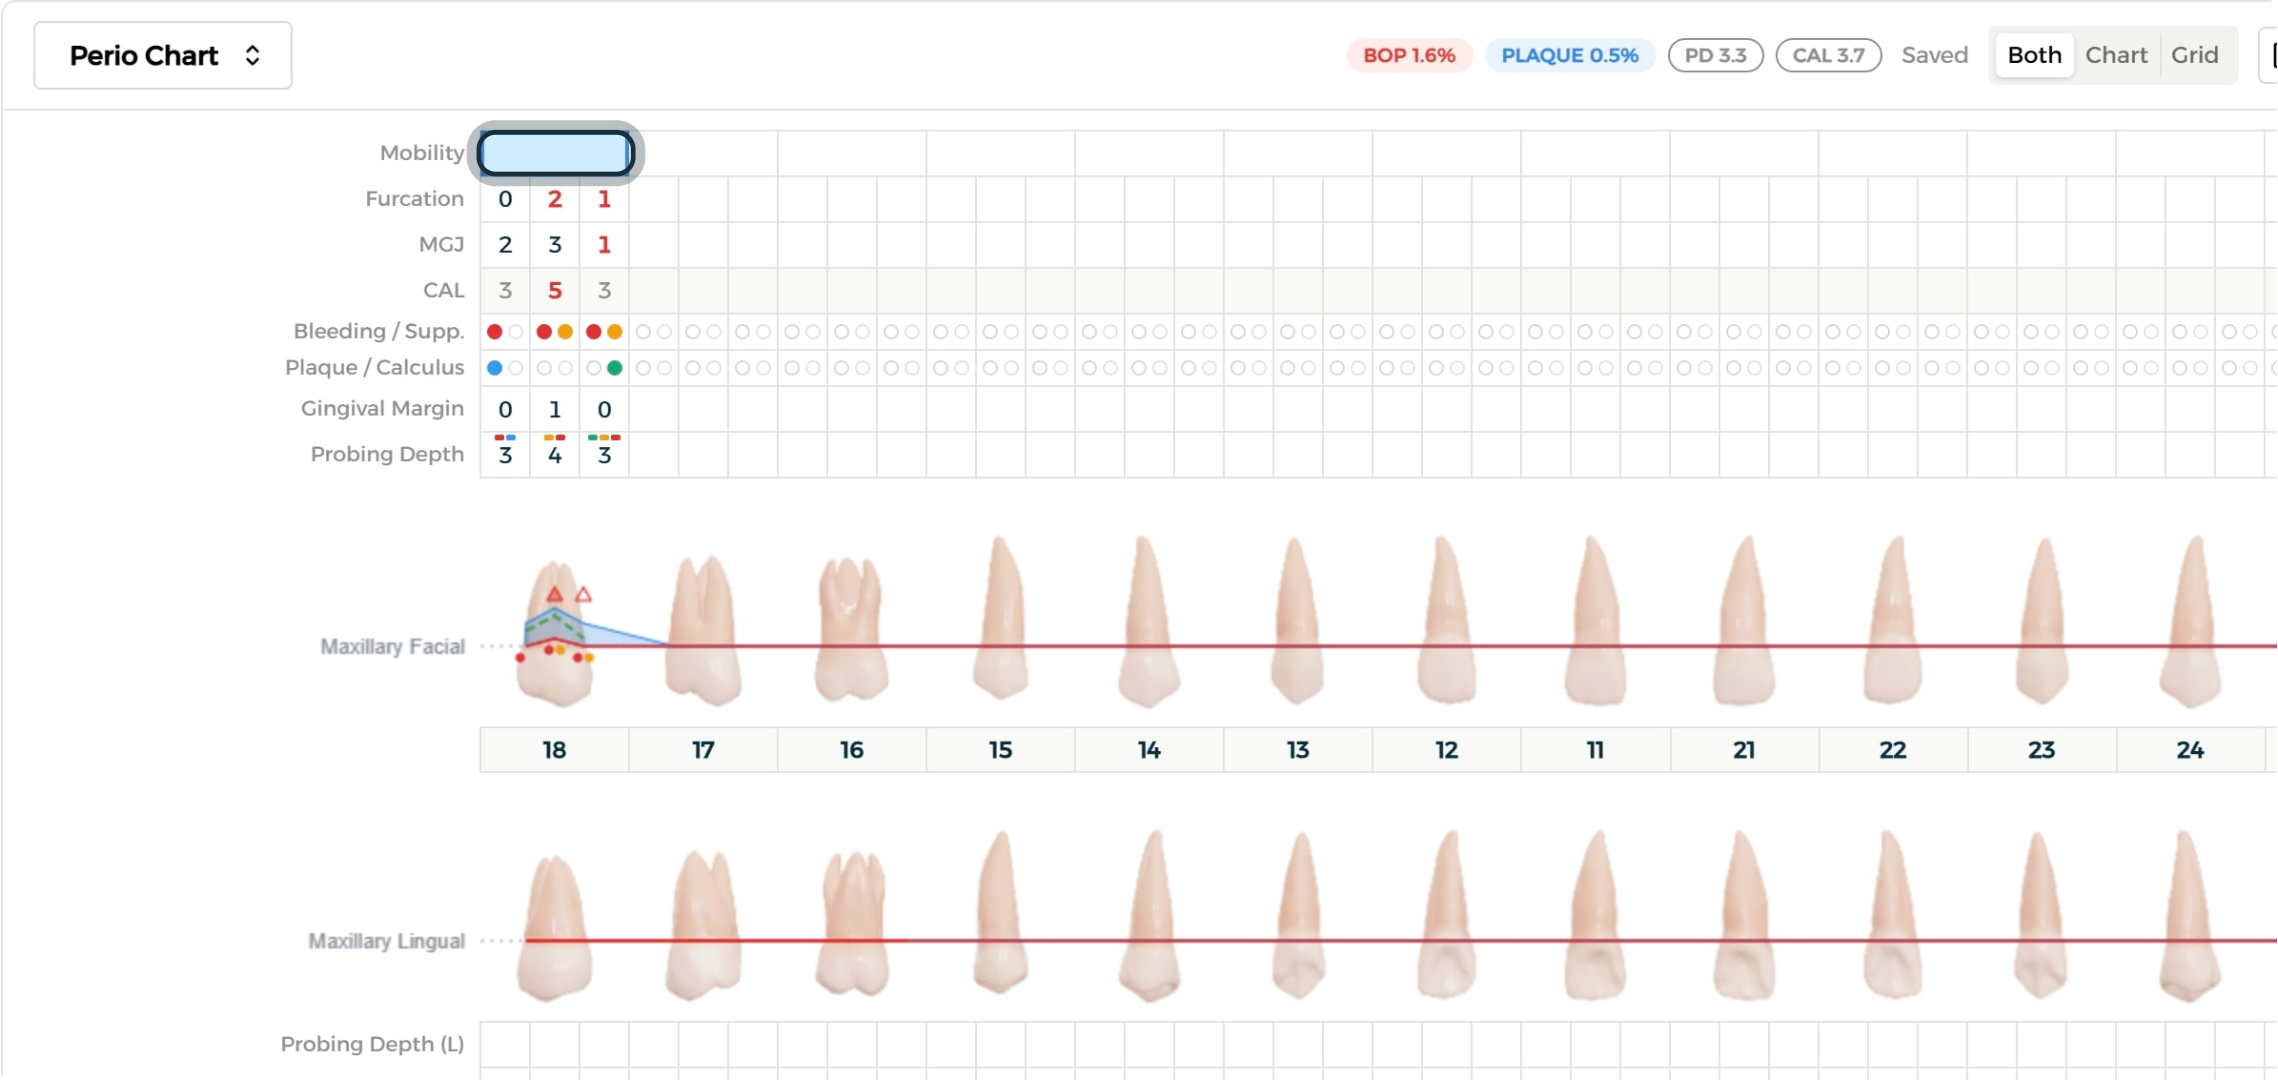
Step 2: Complete the Remaining Measurements
Log the mucogingival junction, then record furcation involvement for multi-rooted teeth, and finish with mobility to evaluate tooth movement.
Managing Missing Teeth and Faster Entry
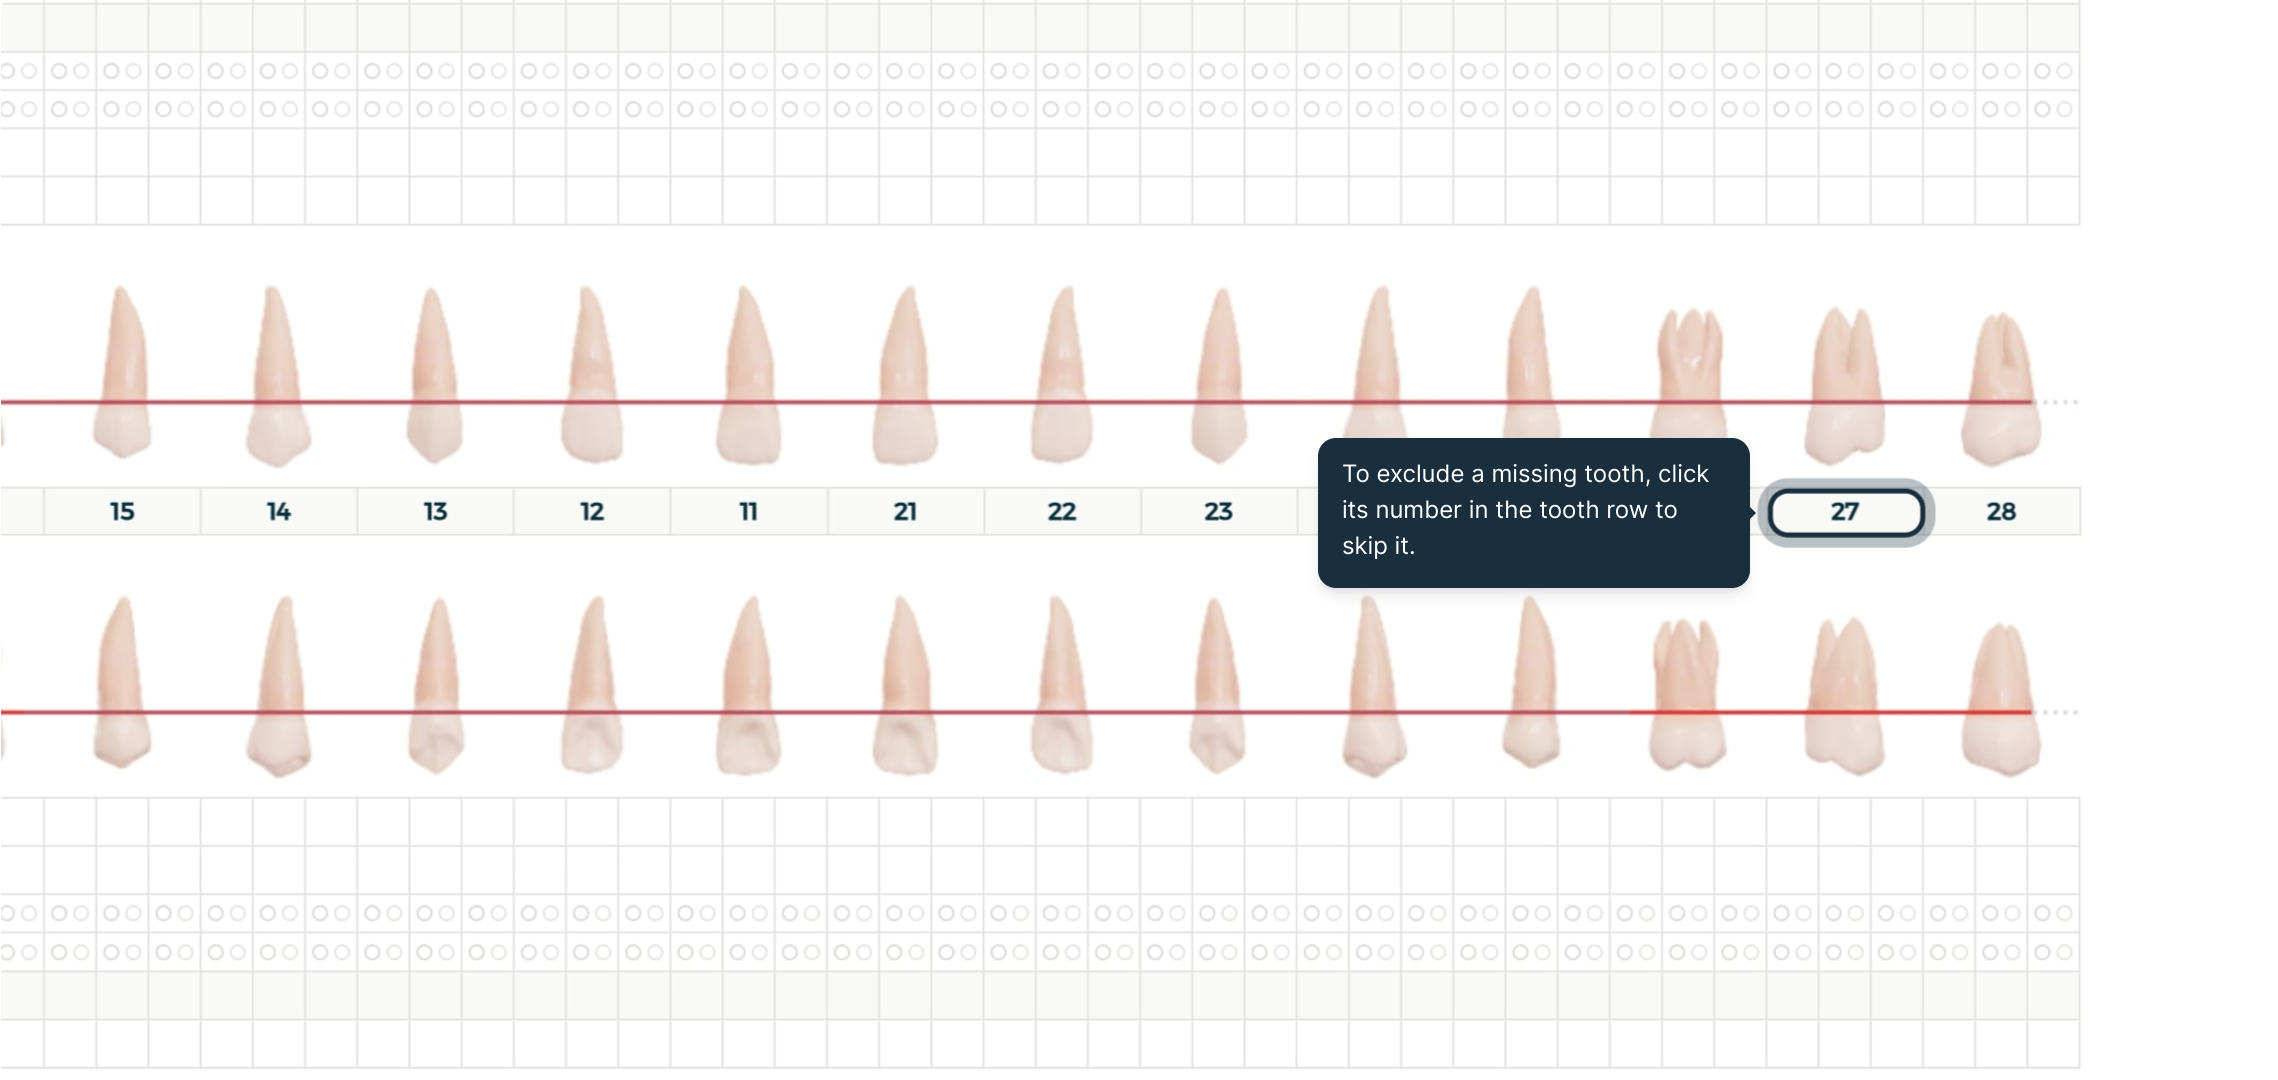
Step 1: Exclude a Missing Tooth
Click a tooth's number in the tooth row to skip it — it's greyed out and left out of every index.
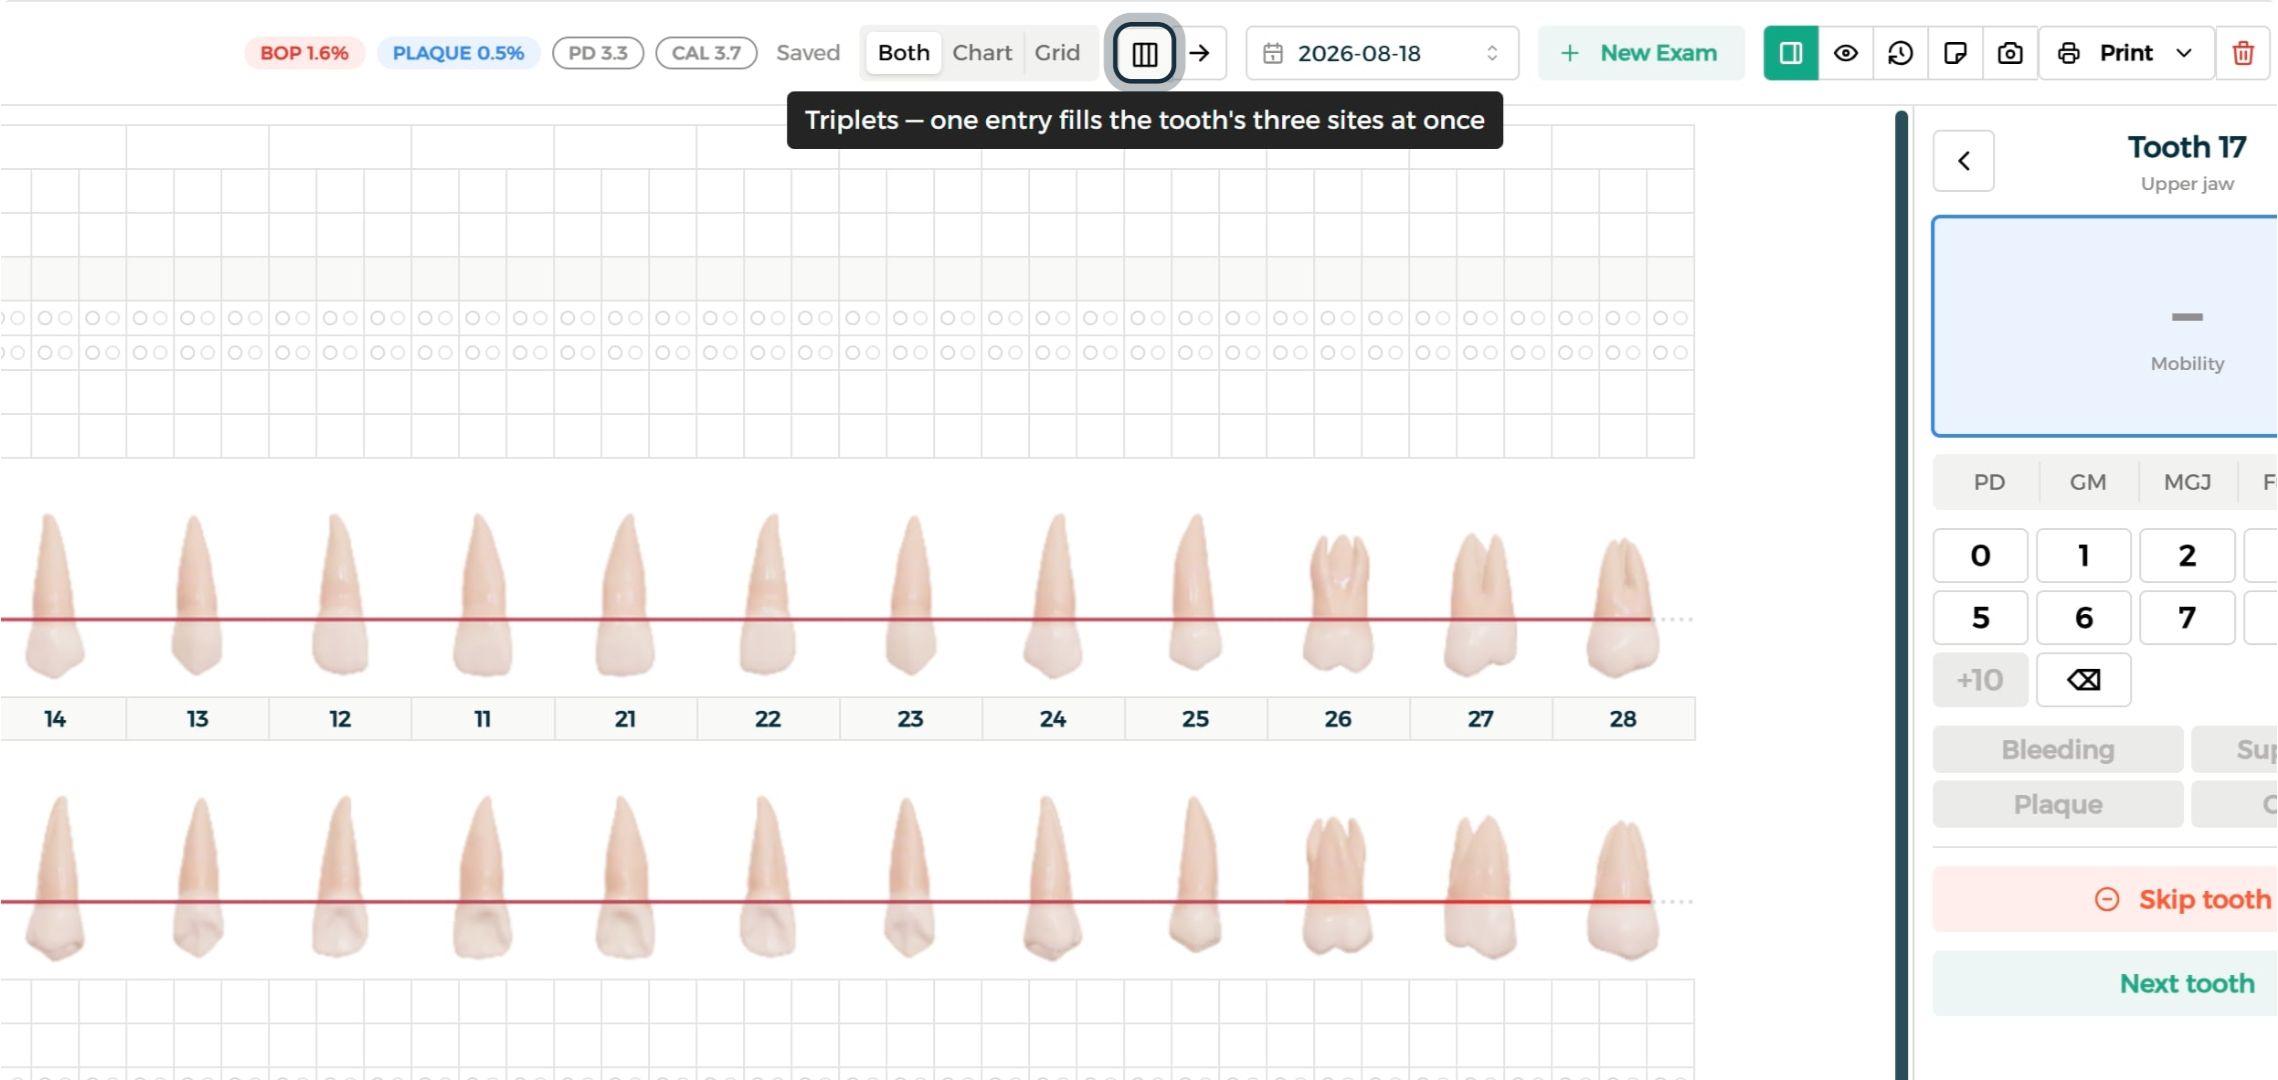
Step 2: Enable Triplets Mode for Faster Logging
Turn on Triplets mode so a single value entry automatically fills all three sites of a tooth at once.
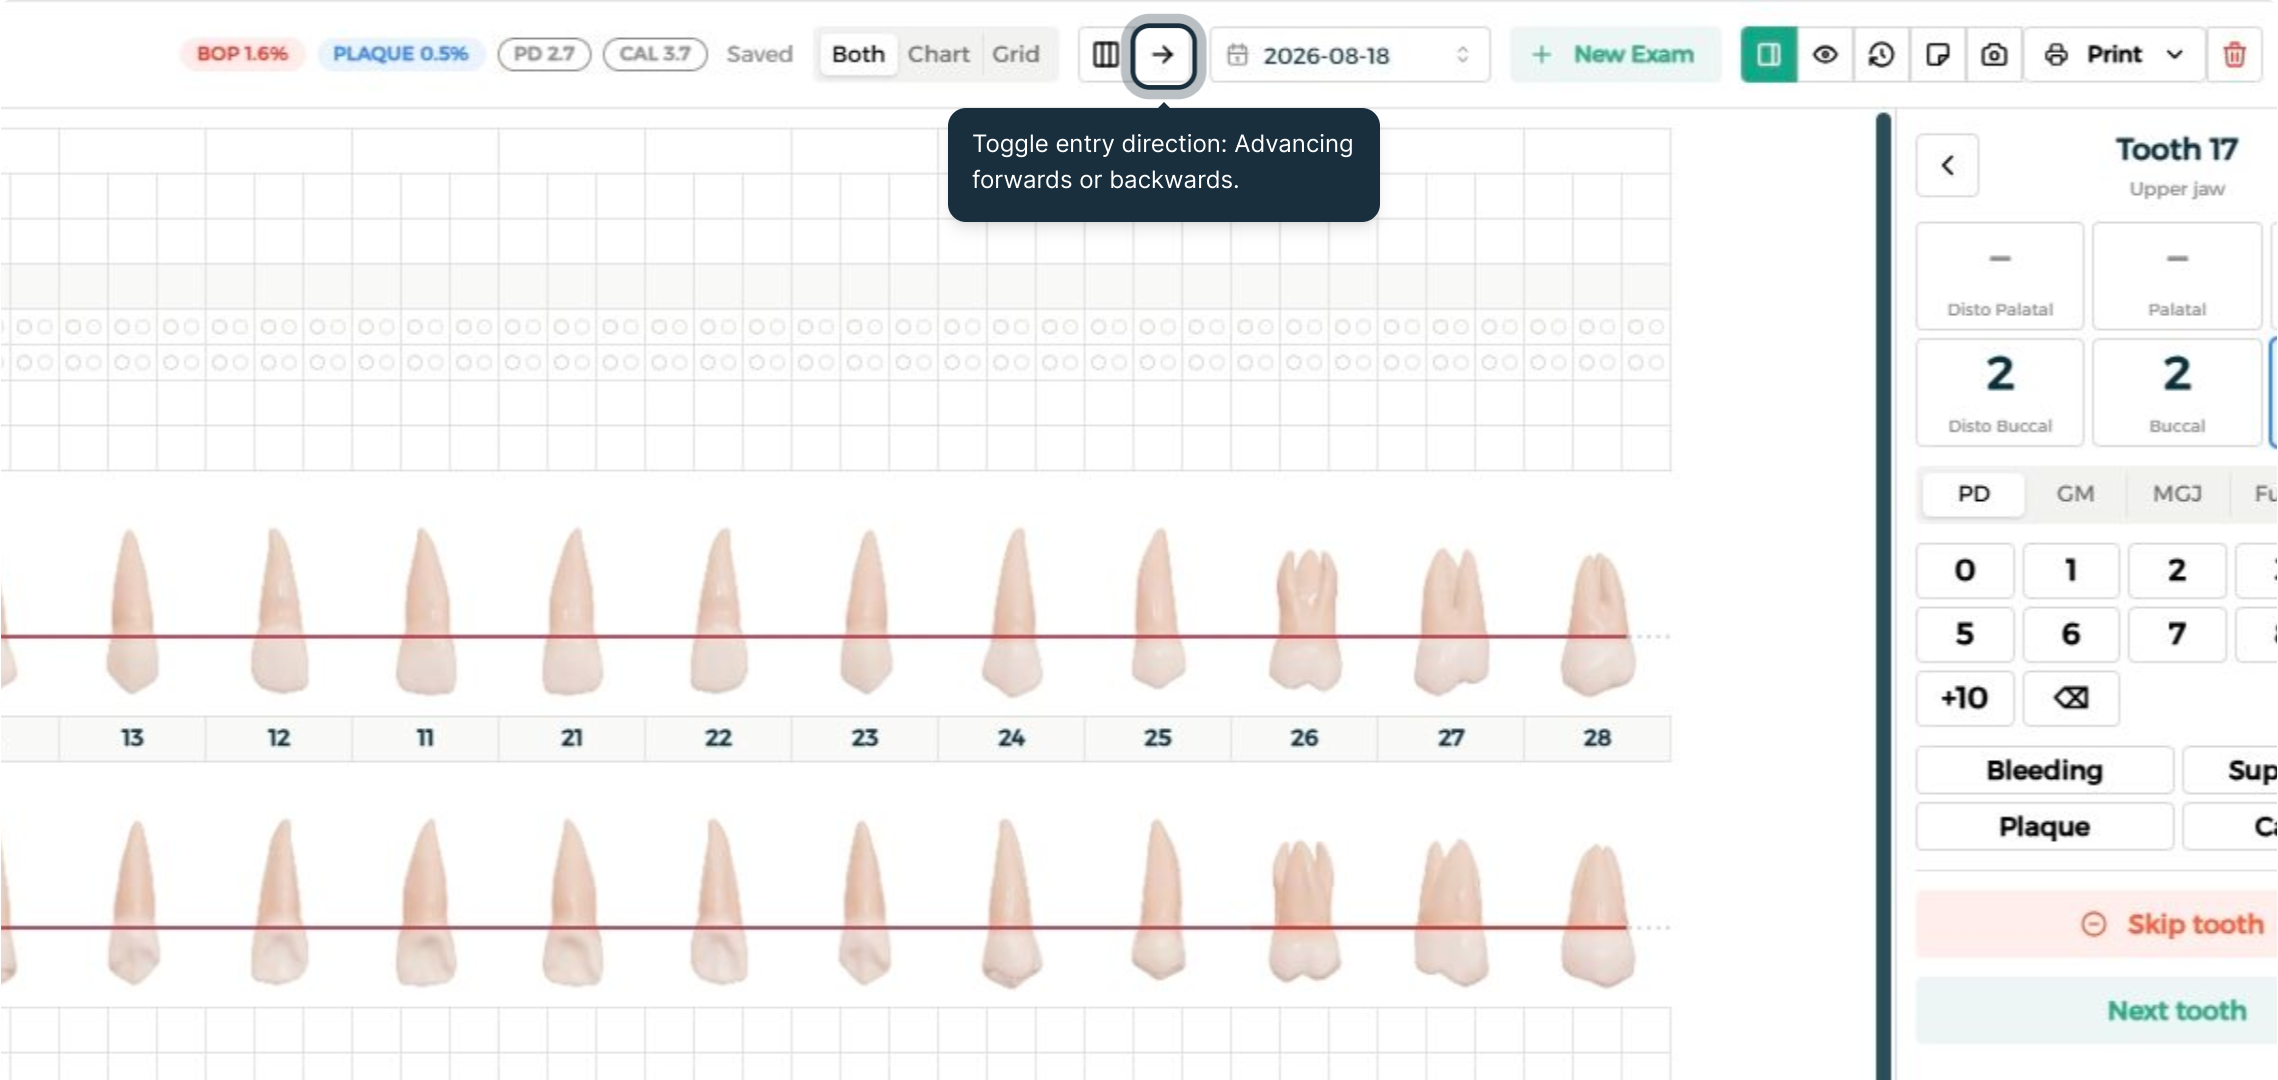
Step 3: Toggle the Entry Direction
Use this control to switch data entry between advancing forwards or backwards through the teeth, to match your workflow.
Switching Chart Views
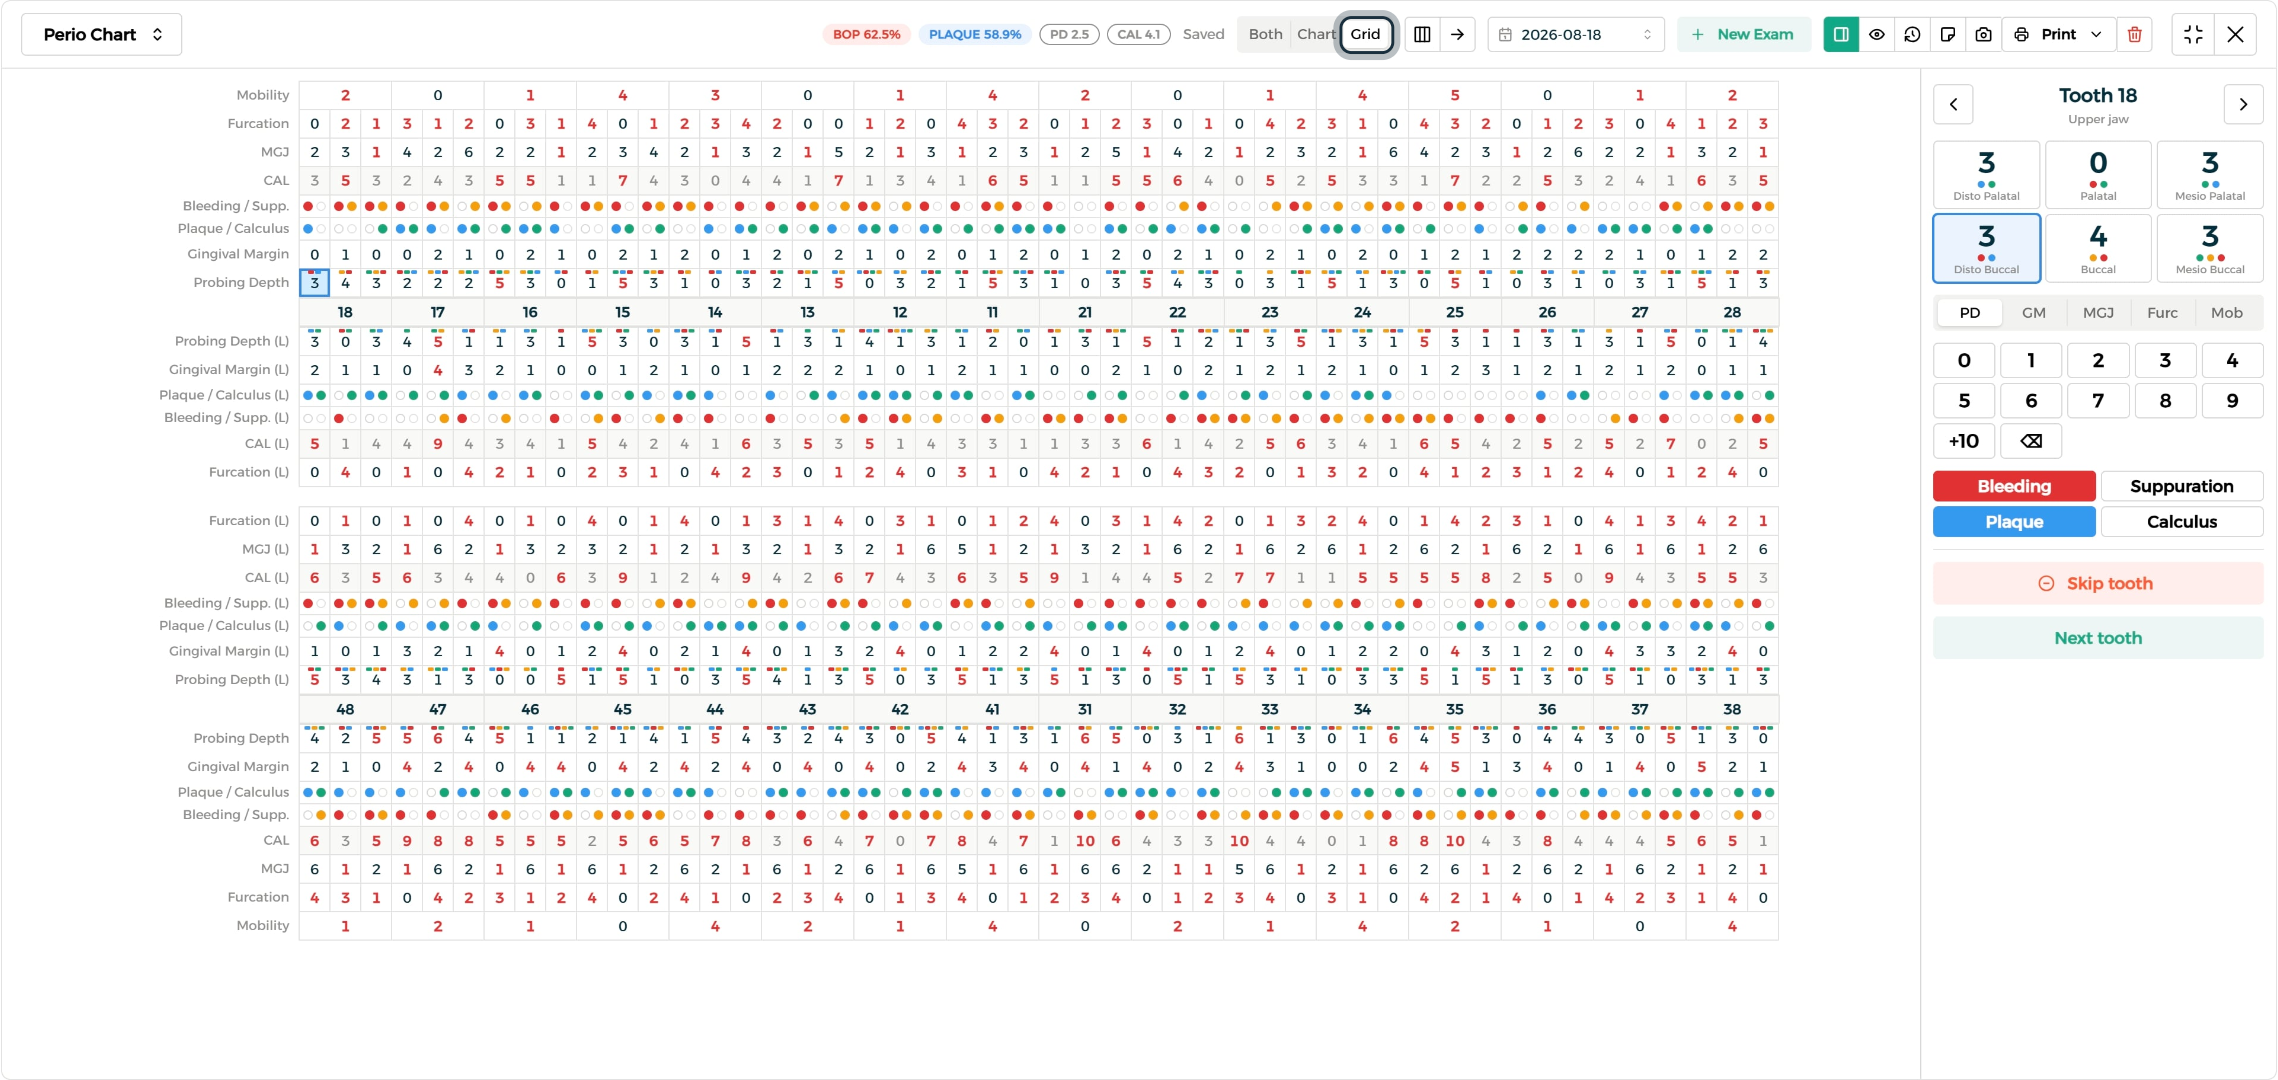
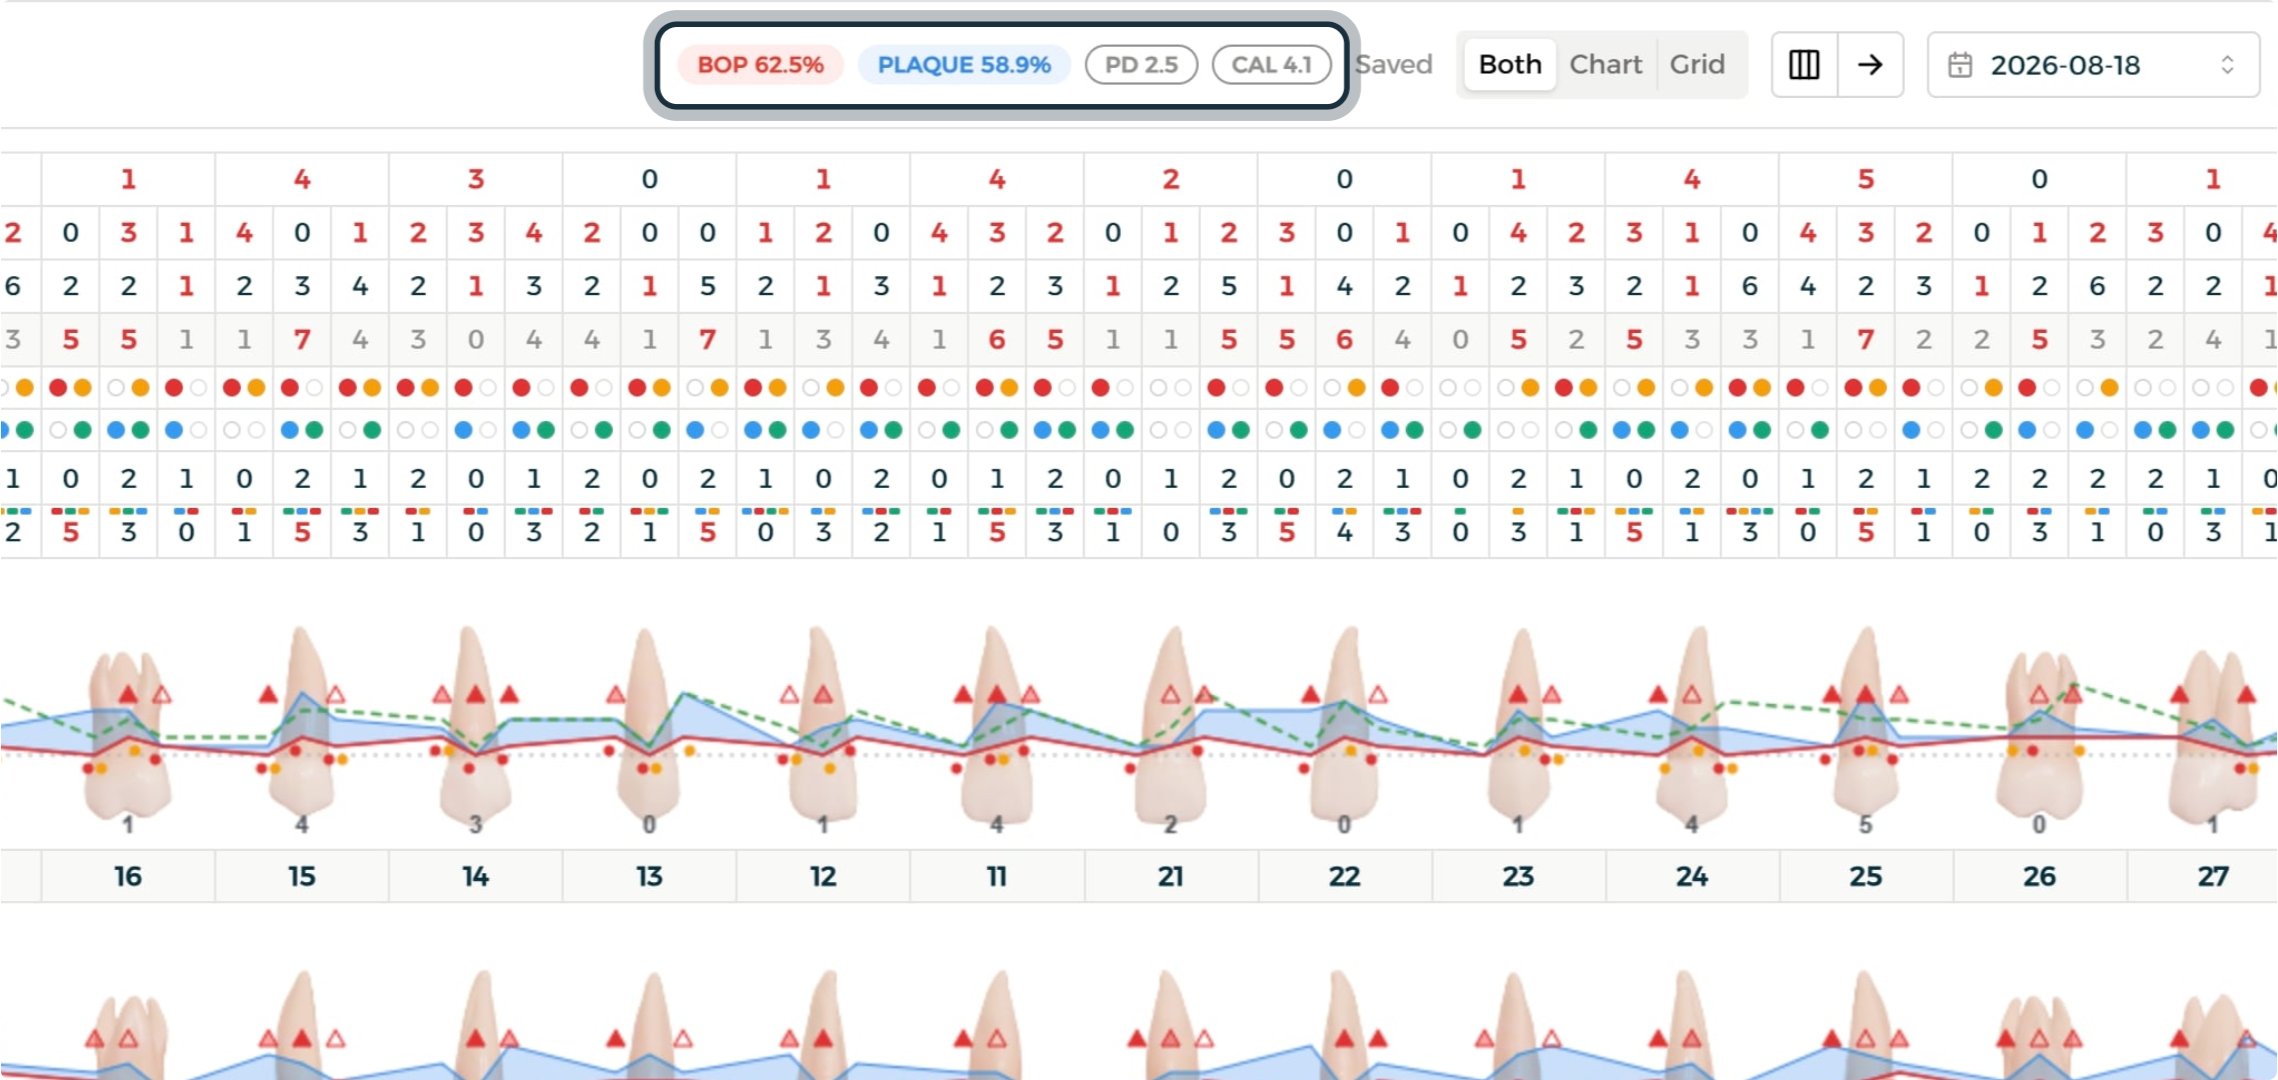
Step 1: Switch Between Chart, Grid, and Both Views
Use the view control to see only the graphical chart, only a numeric grid showing every recorded value tooth by tooth, or both together on one screen.
Step 2: Review Summary Indices
At the top of the combined view, badges track bleeding on probing (BOP), plaque, probing depth (PD), and clinical attachment level (CAL).
Managing Visibility, History, and Notes
Step 1: Hide Specific Measurement Rows
Open the visibility menu and untick a row to hide it from both the chart and the grid.
Step 2: Review Exam History
Open exam history to see every past exam listed with its indices, so results can be compared over time.
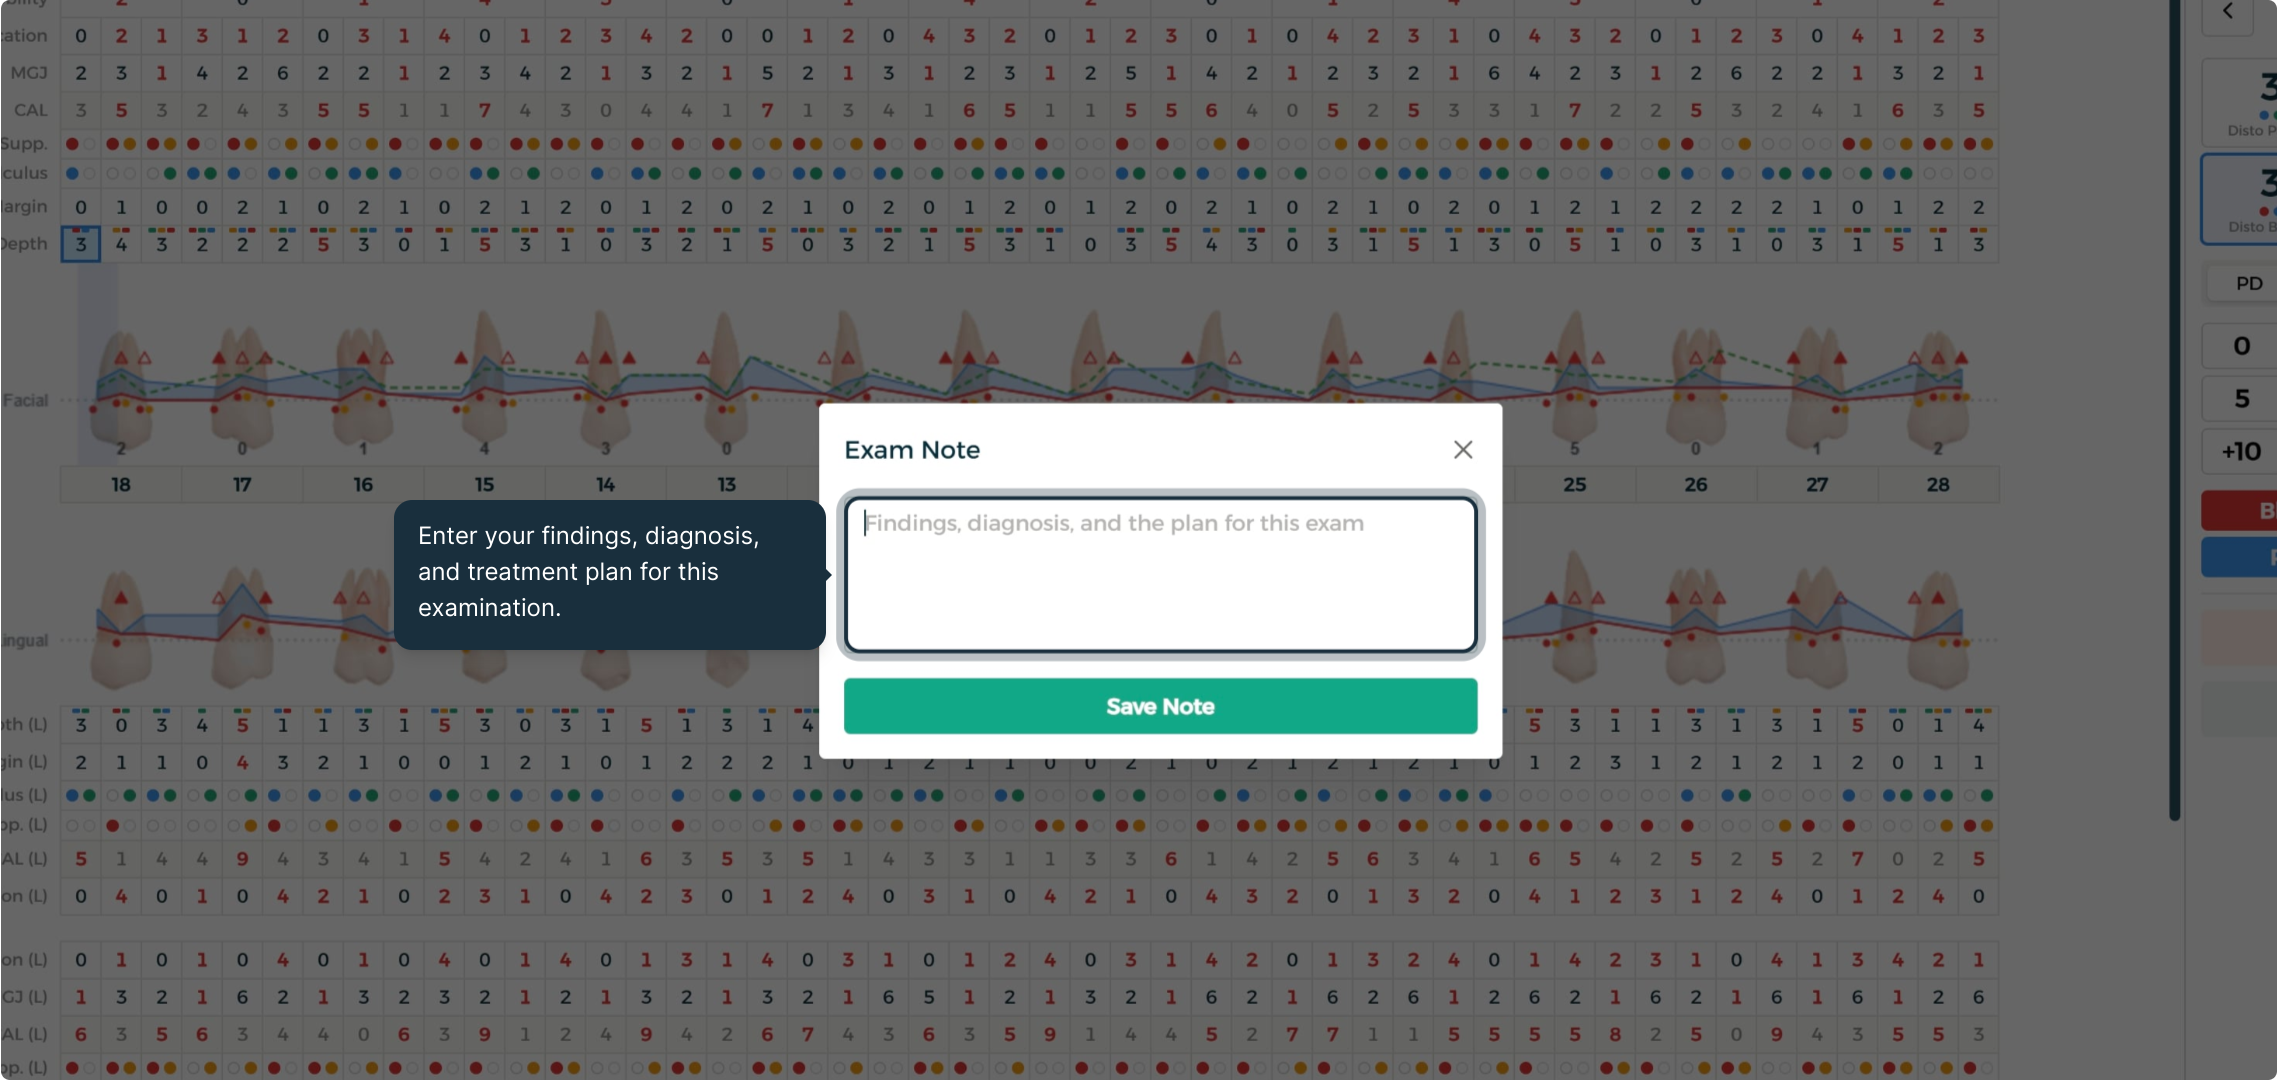
Step 3: Add an Exam Note
Click the note icon and type in findings, diagnosis, and the plan for this exam.
Saving and Exporting the Chart
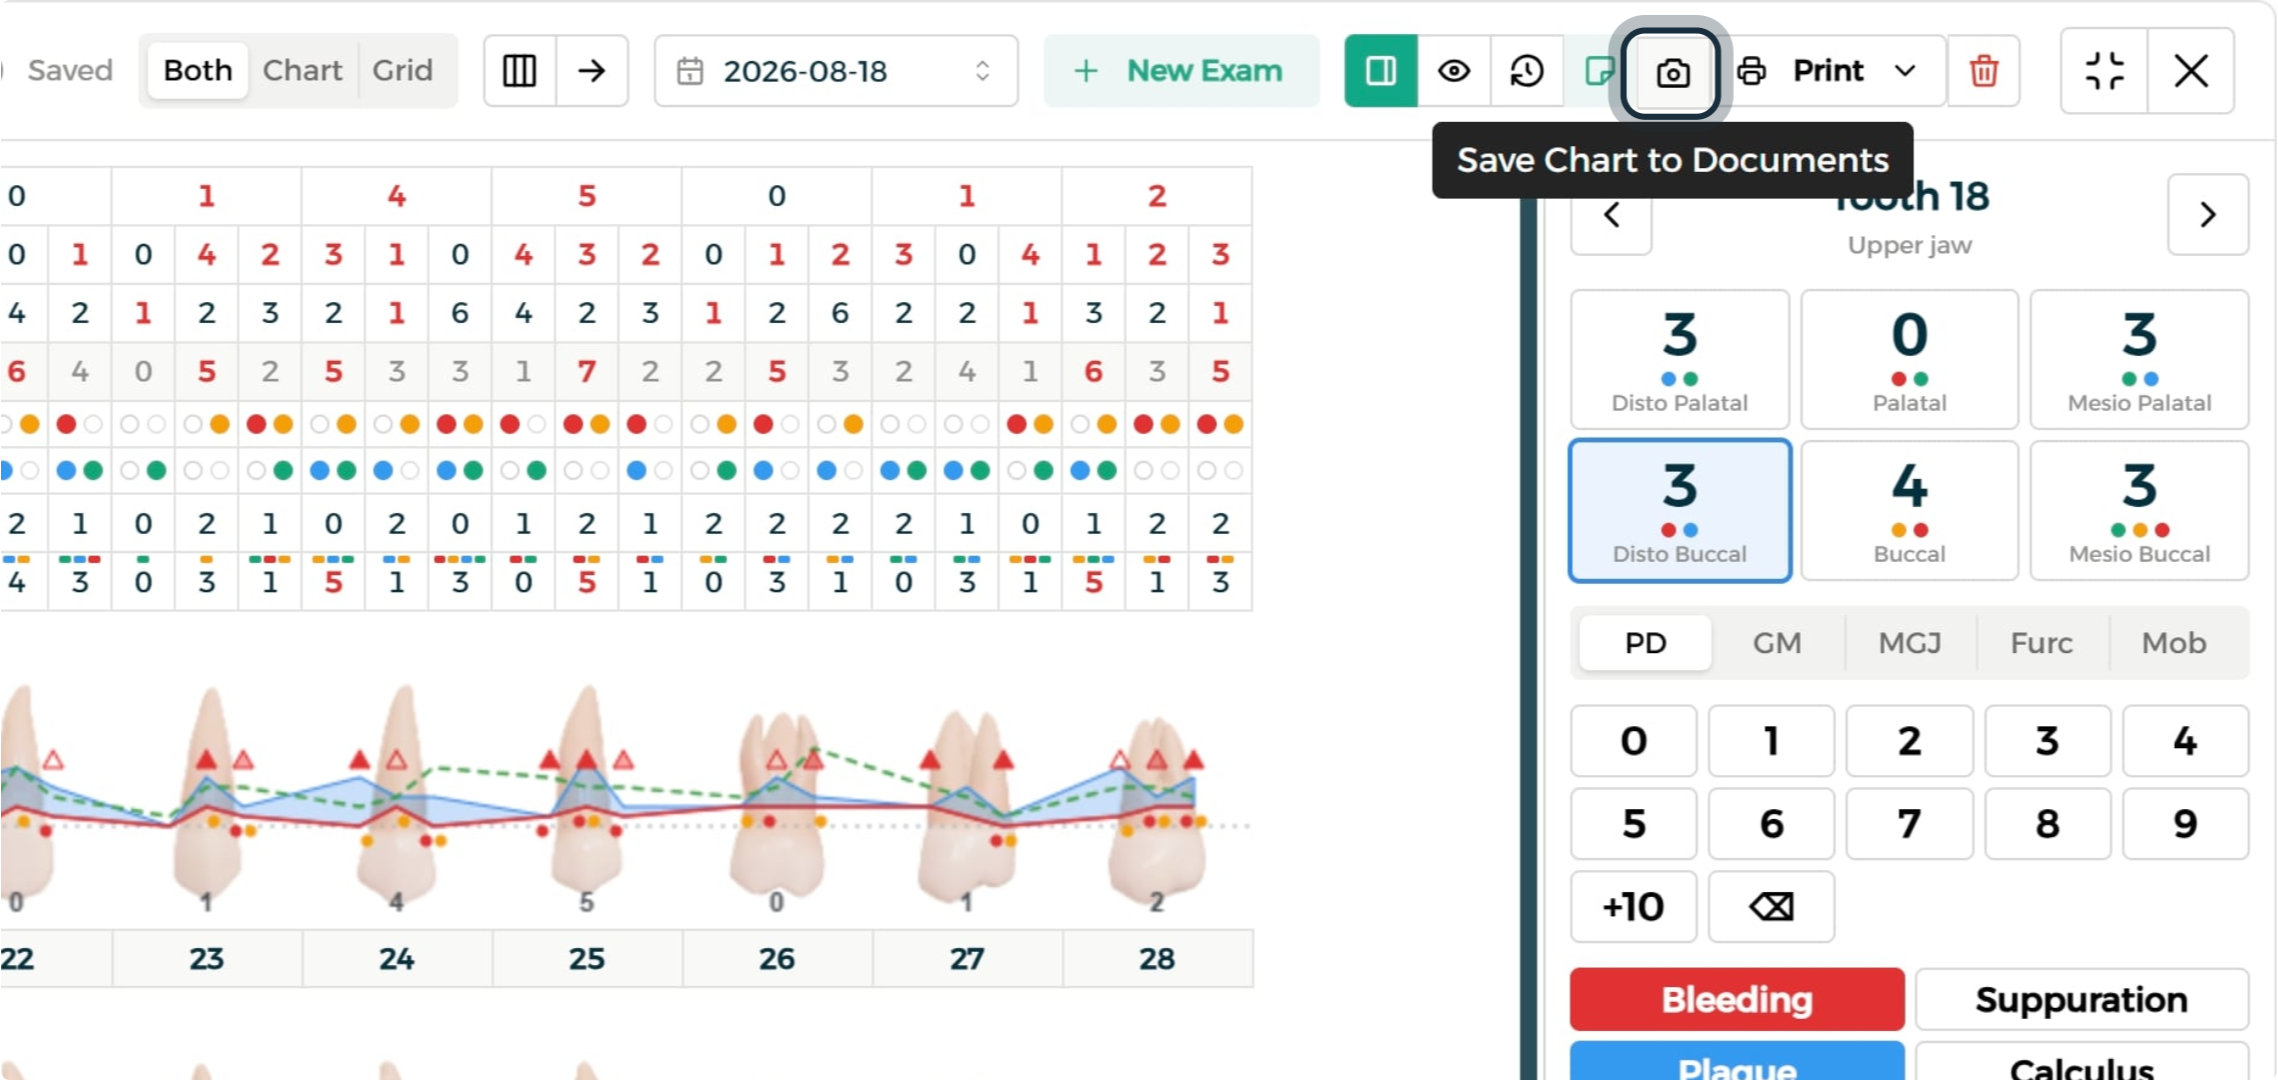
Step 1: Save a Snapshot to Patient Documents
Click the camera icon to save the chart directly to the patient's documents folder.
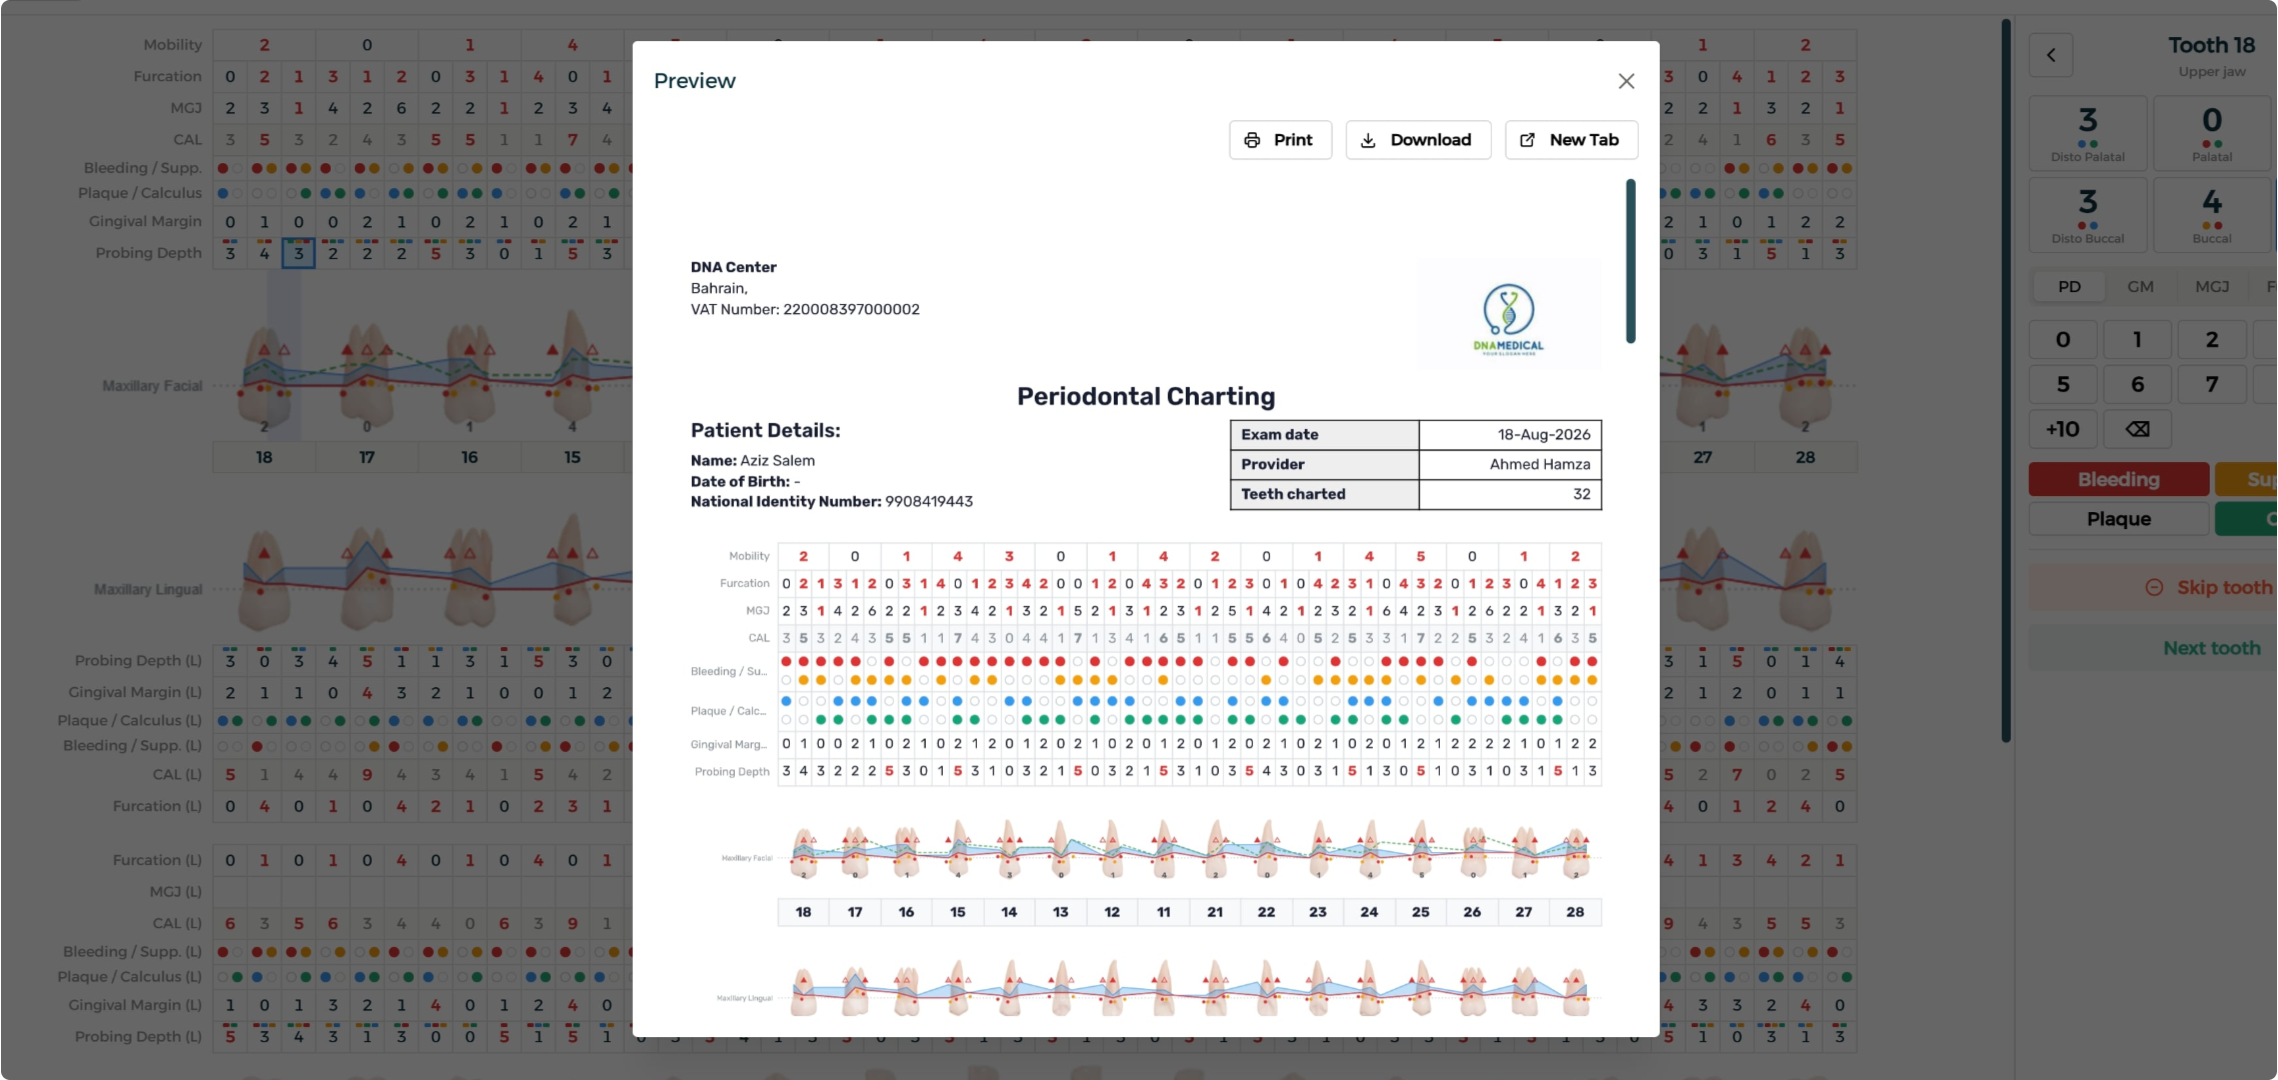
Step 2: Preview, Print, or Download the Full Report
Open the Print menu and select Preview to review the complete periodontal report — including detailed statistics — right inside the system before printing or downloading.
End-to-End Workflow
- Open the patient's profile and go to Charts, then select the Perio Chart.
- Start a new exam and review the tooth panel and measurement tabs.
- Record probing depth and gingival margin for each site.
- Log clinical surface indicators, then complete MGJ, furcation, and mobility.
- Exclude any missing teeth and enable Triplets mode or toggle entry direction to speed up entry.
- Switch between chart, grid, and combined views to review the data.
- Manage row visibility, review exam history, and add an exam note.
- Save a snapshot to patient documents, then preview and export the full report.
Best Practices
- Work tooth by tooth, site by site. Completing all measurements for one tooth before moving on keeps the exam consistent and avoids missed sites.
- Use Triplets mode for healthy teeth. It speeds up entry when the same value applies across all three sites.
- Exclude missing teeth early. This keeps chart indices accurate as you work through the rest of the exam.
- Check flagged measurements. Values marked in red have crossed a clinical threshold and are worth a second look before finishing the exam.
- Add an exam note before saving. Recording findings, diagnosis, and plan alongside the numeric data gives better context for future visits.
FAQ
Q: What measurements does the Perio Chart record per tooth? It records probing depth, gingival margin, MGJ, furcation, and mobility across six sites per tooth, along with bleeding, suppuration, plaque, and calculus indicators.
Q: How is the Clinical Attachment Level calculated? It calculates automatically once probing depth and gingival margin are logged for a site.
Q: What does Triplets mode do? It lets a single value entry automatically fill all three sites of a tooth at once, speeding up data entry.
Q: How do I exclude a tooth that's missing? Click that tooth's number in the tooth row — it's greyed out and excluded from every index.
Q: Can I see previous exams for the same patient? Yes, the exam history lists every past exam with its indices so you can compare results over time.
Q: How do I export the completed chart? Use the Print menu and select Preview to review the full report, or print/download it directly from the preview controls.
Q: Can I control which measurement rows are visible? Yes, the visibility menu lets you untick any row to hide it from both the chart and the grid.